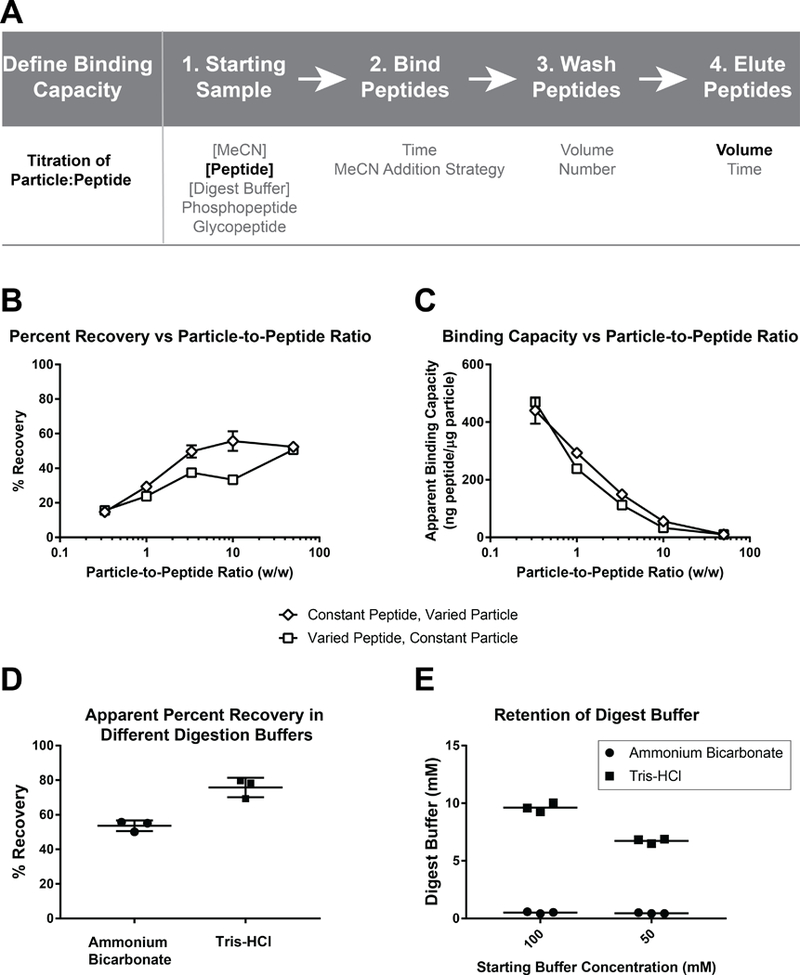
Figure 1: Overview of SP2 workflow, variables tested, and assessment of peptide recovery with varying particle:peptide ratios and digestion buffers.

(A) Overview of the SP2 strategy and experimental variables tested at each stage of the protocol. The variables indicated by emboldened font were determined to be most critical for SP2 performance. (B) Percent recovery is plotted against the particle-to-peptide ratio demonstrating a positive, saturable relationship. (C) The apparent binding capacity is plotted against the particle-to-peptide ratio demonstrating a negative correlation. (D) The calculated percent recovery when peptides are digested in either AmBic or Tris buffer. (E) The calculated concentration of digestion buffer retained when either AmBic or Tris buffer is subjected to SP2. All conditions were tested in technical triplicate. The mean is shown as a symbol, in (B-C), or as line, in (D-E), ± the standard deviation.
