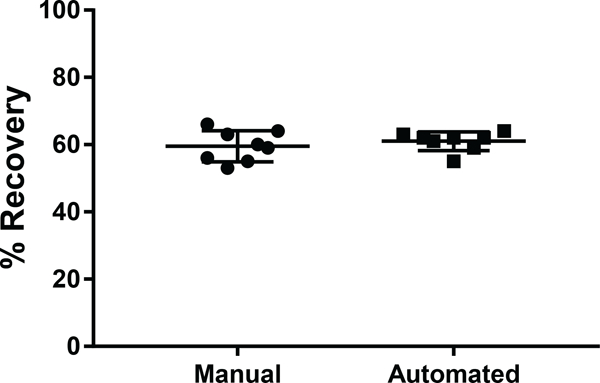
Figure 6. Comparing percent recovery and reproducibility between manual and automated SP2.

The percent recovery is plotted for eight technical replicates of digested lysate cleaned by SP2 using both the manual and automated modes of operation. The mean is shown as a horizontal bar ± standard deviation.
