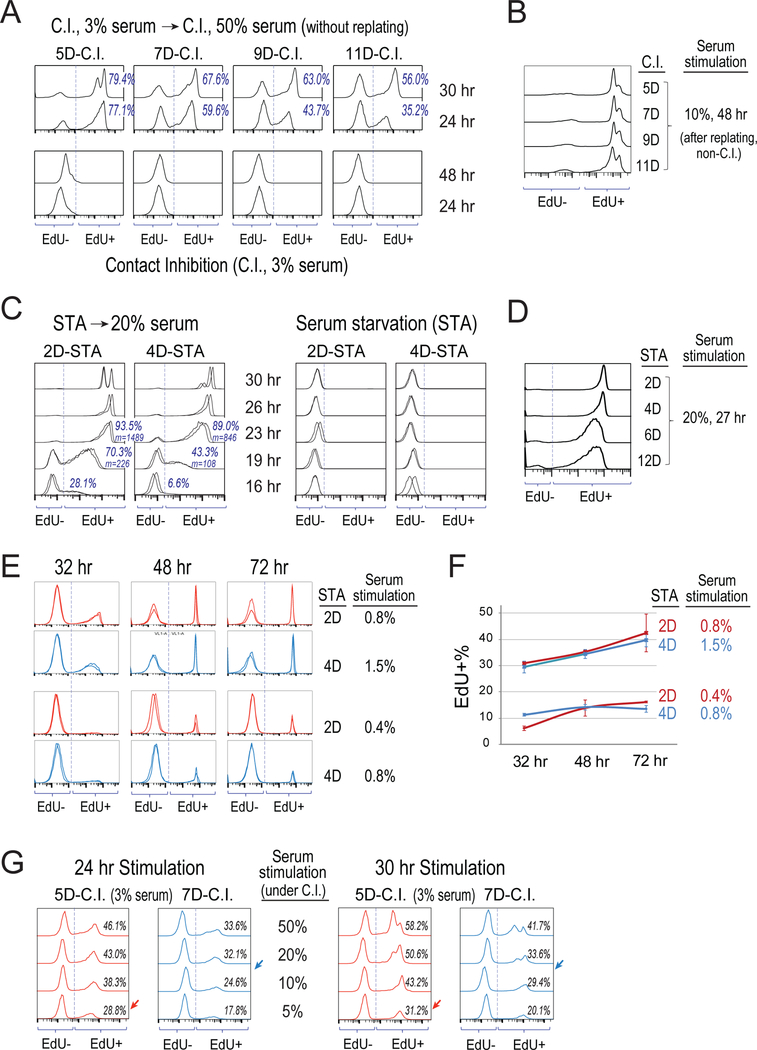
Figure 1. Measure dynamic features of deep vs. shallow quiescence.
(A-G) S-phase entry following serum stimulation of quiescent cells. Cells were induced to quiescence by contact inhibition (seeded at 3× normal confluency in 3% serum) for 5–11 days (A,B,G) or serum starvation (cultured in 0.02% serum) for 2–12 days (C-F). At time 0, cells were stimulated with higher concentrations of serum as indicated or remained non-stimulated (C.I. control in A, and STA control in C), and with EdU added to the culture medium. Cells were harvested at indicated time points afterwards and measured for their incorporated EdU intensity by flow cytometry. Each histogram represents the distribution of EdU intensity (x-axis) from approximately 10,000 cells, with y-axis = cell number with the height of the (higher) mode normalized to 100%. For serum stimulation of C.I. cells, cells were either stimulated directly while remained at the C.I. condition (A,G) or first replated at a non-C.I. condition prior to serum stimulation (B), as indicated. (A,C) Percentage of EdU+ cells are shown; m = mean EdU intensity of EdU+ cells. Results from duplicate EdU assays are shown in C for each condition. (E,F) Cell division was restricted by low dose of nocodazole at the time of assay (see Methods). Percentages (mean ± s.e.m.) of EdU+ cells calculated in E (duplicates) are shown in F.

