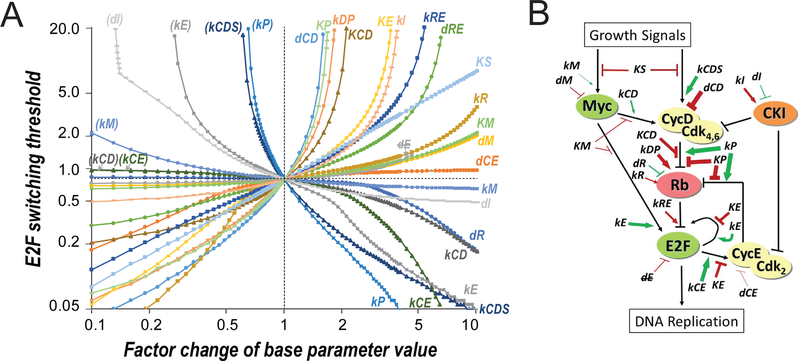
Figure 3. In silico modulators of the E2F switching threshold.
(A) Parameter-sensitivity curves. X-axis = factor change of parameter value. Y-axis = E2F switching threshold (% serum). Both axes are in logarithmic scale. Parameters in parenthesis = repeated parameter labels of those in the lower right quadrant. dE indicates that dE was not considered as a sensitive parameter as increasing its value diminished the separation of E2F-ON and -OFF states (to < 10% of that in the base model) before affecting the E2F switching threshold significantly (i.e., with a factor change > 2.5). Parameter changes resulting in a higher E2F switching threshold (top half) also caused delayed E2F activation upon serum stimulation (see Figures S1A and S1B). (B) Modulators of the E2F switching threshold. Modulators (sensitive parameters) are labelled at their effective positions in the Rb-E2F pathway network. Green and red = increasing the parameter value decreased and increased the E2F switching threshold, respectively. Arrow and bar = increasing the parameter value positively and negatively affected the strength of the pointed node/link, respectively. Thickness of arrow/bar = parameter sensitivity when increasing the parameter value, as determined in the right half of A.

