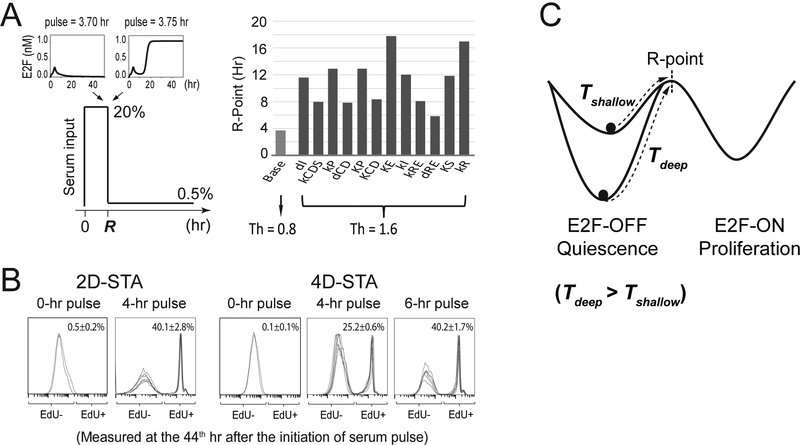
Figure 4. Deep quiescent cells exhibit delayed passing of the R-point.
(A) Simulated traverse time of the R-point. (Left) Model simulation scheme to determine the time to traverse the R-point (R), which corresponds to the shortest duration of a given serum stimulation (20%) required to activate and sustain the ON-state of the Rb-E2F bistable switch. When the serum duration is shorter than R (upper left inset), the final E2F level will return to the OFF state after the serum input is reduced to a basal level (0.5%); otherwise, the final E2F level will reach and remain at the ON state, even after the serum input is reduced to the same basal level (upper right inset). (Right) Simulated R traverse time (according to the scheme on the left) in the base model (E2F switching threshold Th = 0.8) and with parameter “mutations” that doubled the E2F switching threshold (Th = 1.6). The order of parameters is the same as shown in the top half of Figure 3A. Parameter mutations resulting in Rb-E2F deactivation threshold > 0.5% are not shown. See also Figures S1C and S1D (for deterministic simulation) and Table S3 (for stochastic simulation). (B) Experimentally measured quiescence exit after short serum pulses. Quiescent cells obtained by serum starvation for 2 or 4 days were stimulated with strong serum pulses (20%, at indicated durations), followed by incubation at a basal serum level (0.3%). Cells were harvested at the 44th hour after serum stimulation and measured for EdU incorporation (six replicates in 4- or 6-hr pulse groups and duplicates in 0-hr pulse control groups). Each histogram represents the distribution of EdU intensity from approximately 10,000 cells (y-axis, the same as Figure 1). Cell division was restricted by low dose of nocodazole at the time of assay (see Methods). (C) Time to traverse the R-point is dependent on quiescence depth. Following a given serum stimulation, the time to reach the R-point from deep quiescence (Tdeep) is longer than that from shallow quiescence (Tshallow).

