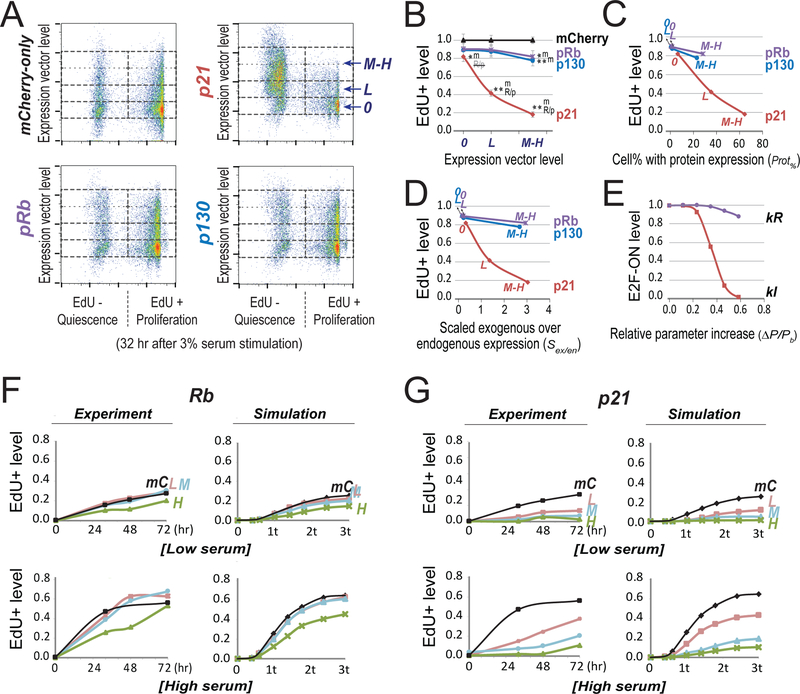
Figure 5. Experimentally create deep quiescence by increasing E2F switching threshold with Cdk inhibitor p21 and Rb family proteins.
(A) Quiescence exit affected by ectopic expression of p21, pRb and p130. Quiescent cells (2D-STA) containing transfected expression vectors were switched to media containing 3% BGS and EdU, and harvested 32 hours later for EdU incorporation assay. Cell division was restricted by low dose of nocodazole at the time of assay (see Methods). Y-axis = levels of the introduced expression vector in individual cells (indicated by the fluorescence intensity associated with the co-transfected mCherry vector; see also Figure S2). 0, L, and M-H = cell bins of non-transfected, with low and medium-high level of introduced expression vector, respectively. X-axis = EdU-incorporation intensity. (B) Quiescence-exit (EdU+) cell proportion (y-axis) as a function of expression vector level (x-axis). The EdU+ proportion was calculated from six replicate experiments as in A (with the average EdU+% at each expression vector level normalized to that of the mCherry-only control, see Table S4). Single and double star signs (* and **) indicate statistical significance (p < 0.01 and p < 0.001, respectively) in one-sided t-test comparing the data point by the star sign and the text-indicated data point (m, mCherry; R/p, pRb/p130). R/p, the difference from R/p is not statistically significant. Error bar, standard error of the mean. (C,D) Introduced expression vector levels (0, L, M-H) were converted to cell percentages with positive ectopic protein expression (C) and estimated exogenous protein levels (normalized by endogenous expression, D), respectively, as measured by immunoflow cytometry (see Figure S3 for detail). High ectopic p21 expression in quiescence did not cause irreversible arrest (see Figure S4). (E) Simulated quiescence exit affected by parameter changes. X-axis = relative parameter increase (Δ P/Pb = (P-Pb)/Pb, with P = parameter value and Pb = base value). Y-axis = proportion of cells that were able to turn ON the Rb-E2F switch given a parameter change, calculated from 2,000 stochastic simulations. The cell proportion corresponding to the base parameter was normalized to 1.0. Serum input = 1.2 au (au = activation unit; 1 au = 0.78, the E2F switching threshold in the base model). kR and kI, synthesis rate constants of Rb and p21, respectively. (F,G) Time course of quiescence-exit profiles. (Experiment) The EdU+ cell proportions with exogenously expressed pRb (F) or p21 (G) were measured at indicated time points upon serum stimulation of quiescent cells (2D-STA). Low and high serum = 0.8% and 3.0%, respectively. Cell division was restricted by low dose of nocodazole at the time of assay (see Methods). L, M, H: the same as in A; mC = mCherry-only control. (Simulation) E2F-ON cell proportions were calculated at indicated time points (t = model-time unit of 50 hours) upon serum input (low and high serum = 0.96 and 1.01 au, respectively). Each data point reflects the result of 2,000 stochastic simulations. L, M, H for Rb (F): kR = 0.182, 0.184, 0.19, respectively. L, M, H for p21 (G): kI = 0.158, 0.167, 0.171, respectively. mC: kR = 0.18, kI = 0.15.

