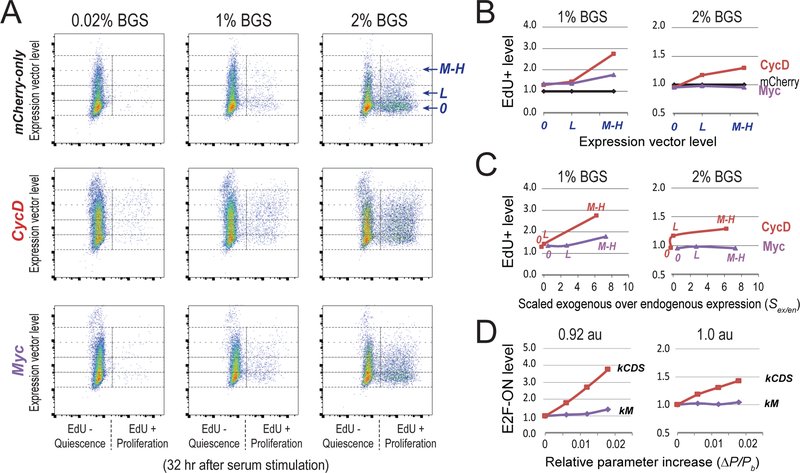
Figure 6. Experimentally create shallow quiescence by decreasing E2F switching threshold with CycD and Myc.
(A) Quiescence exit affected by ectopic expression of CycD and Myc. Quiescent cells (2D-STA) containing transfected expression vectors were switched to fresh media containing serum at the indicated concentrations and EdU, and harvested 24 hours later for EdU incorporation assay. Y-axis = levels of the introduced expression vector in individual cells (as in Figure 5A). 0, L, and M-H = cell bins of non-transfected, with low and medium-high level of introduced expression vector, respectively. X-axis = EdU-incorporation intensity. (B) Quiescence-exit (EdU+) cell proportion (y-axis) as a function of expression vector level (x-axis). The EdU+ proportion was calculated from A for each expression vector level, and normalized to that of the mCherry-only control. (C) Expression vector levels in B were converted to estimated exogenous protein levels (normalized by endogenous expression) as measured by immunoflow cytometry (see Figure S5 for detail). Labels of 0, L, M-H in each curve correspond to the levels of introduced expression vectors. (D) Model simulated quiescence exit affected by parameter changes. X-axis = relative parameter increase, Y-axis = simulated proportion of cells that were able to turn ON the Rb-E2F switch given a parameter change, as in Figure 5E. The cell proportion corresponding to the base parameter was normalized to 1.0. Serum input = 0.92 and 1.0 au (for 1% and 2% BGS), respectively. kCDS and kM, synthesis rate constants of CycD and Myc, respectively.

