
Figure 5.
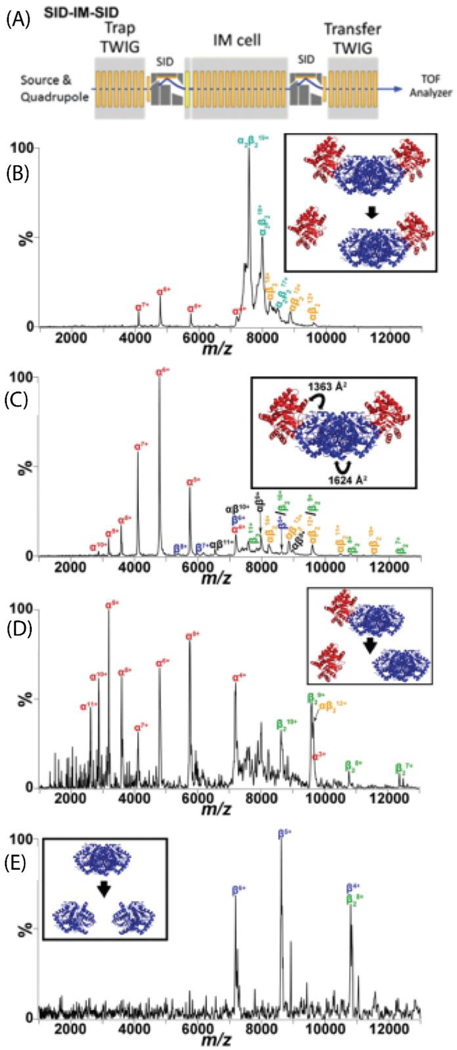
(A) Traveling wave (T-wave) region of the modified Waters Synapt G2-S instrument showing the SID-IM-SID experiments. (B) Low energy SID-IM spectrum for 19+ tryptophan synthase hetero-tetramer (comprised of αββα subunits arranged in a linear fashion) at a collision energy of 570 eV. Inset is the dominant dissociation pathway illustrated with the crystal structure (PDB: 1WBJ). (C) High energy SID-IM spectrum for 19+ tryptophan synthase hetero-tetramer at a collision energy of 1330 eV. The interfaces and corresponding interfacial areas broken are highlighted in the inset. (D) SID-IM-SID of the 12+ αβ2-trimer and (E) 8+ β2-dimer, produced from SID-IM of the tetramer (collision energy of 1330 eV) with the second stage of SID performed at 2280 eV. Insets show the dissociation pathways. Reproduced from Quintyn, R.S., Harvey, S.H., Wysocki, V.H. Illustration of SID-IM-SID (surface-induced dissociation-ion mobility-SID) mass spectrometry: homo and hetero model protein complexes. Analyst, 2015 Oct 21;140(20):7012–9 with permission from the Royal Society of Chemistry.