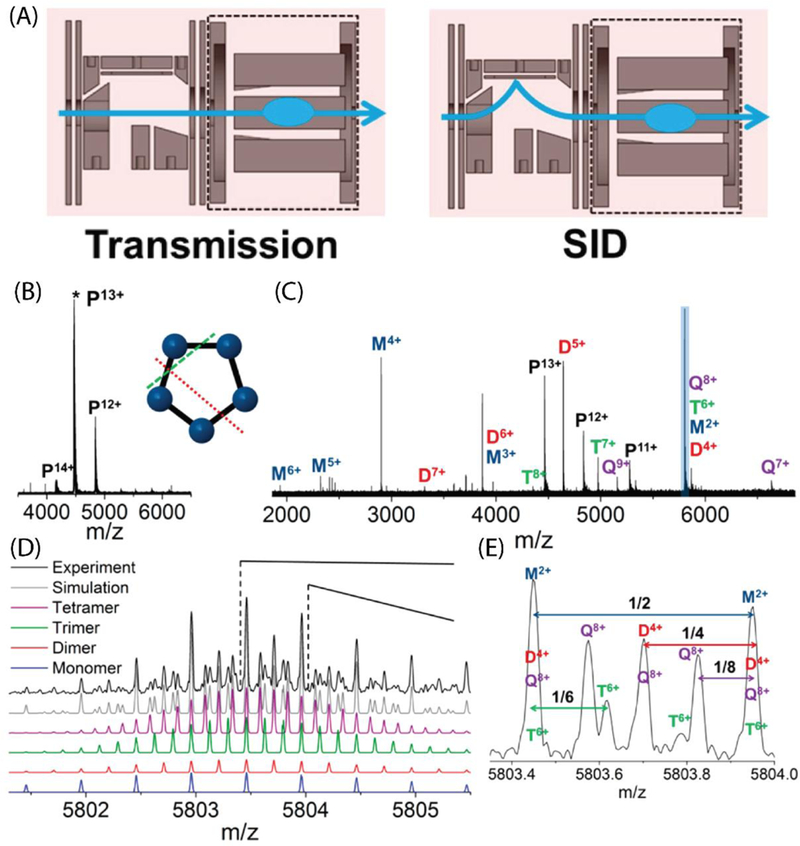
Figure 6.

(A) SID device including SID region and rectilinear quadrupole with four asymptotic electrodes, schematic of transmission mode (left) and SID mode (right). (B) 4 μM CTB pentamer in 100 mM EDDA, acquired by averaging 30 scans with a 4.6 s transient. (C) SID of 13+ CTB pentamer at an SID acceleration voltage of 35 V. The spectrum was acquired by averaging 181 scans with a 9.2 s transient. (D) Zoomed-in region showing the peak highlighted in blue in (B). The experimental data are shown in black and the simulated isotopic distributions from different species are shown in purple (8+ tetramer), green (6+ trimer), red (4+ dimer), blue (2+monomer), and gray (sum of all species). (E) Further zoom in of m/z around 5803.7. Adapted with permission from Yan, J.; Zhou, M.; Gilbert, J. D. ; Wolff, J. J.; Somogyi, A.; Pedder, R. E.; Quintyn, R. S.; Morrison, L. J.; Easterling, M. L.; Paša-Tolić, L.; Wysocki , V. H. Surface-Induced Dissociation of Protein Complexes in a Hybrid Fourier Transform Ion Cyclotron Resonance Mass Spectrometer, Anal. Chem. 2017, 89, 895, Copyright 2018 American Chemical Society.
