
Figure 8.
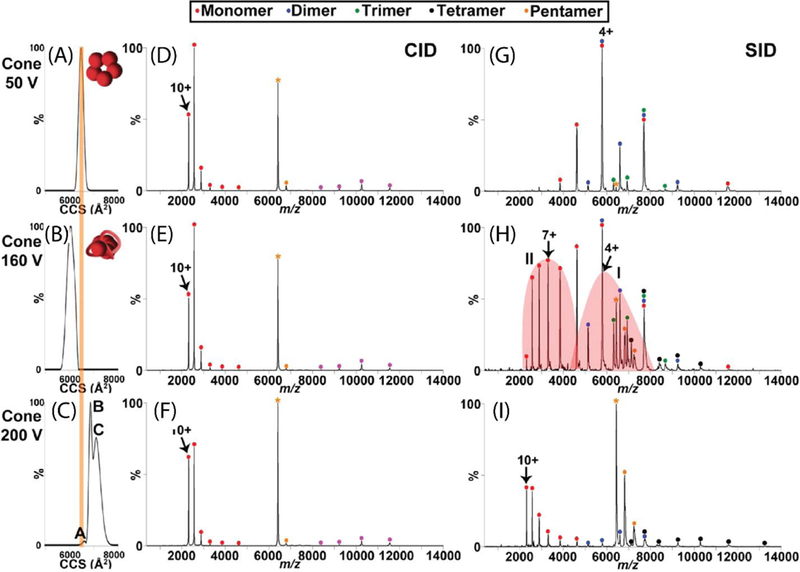
The effect of cone activation (collisional in-source activation) on CID and SID spectra of C-reactive protein (CRP). (A, B and C) demonstrate CCS plots of the +18 CRP pentamer at 50 V, 160 V, and 200 V cone activation, respectively. The theoretical CCS calculated from the crystal structure is overlaid as an orange line on these plots. CID and SID spectra are shown at these same cone activation energies in (D, E, and F) and (G, H, and I), respectively. While CID products show a highly-charged monomer and complementary tetramer regardless of the in-source activation, SID products reflect the structural rearrangement induced by this cone activation and suggest rearrangement to a more stable but less native conformation upon the highest energy of cone activation. Reprinted with permission from Quintyn, R. S.; Zhou, Z.; Yan, J.; Wysocki, V. H., Surface-induced dissociation mass spectra distinguish different structural forms of gas-phase multimeric protein complexes, Analytical Chemistry, 2015, 87, 11879–11886. Copyright 2015 American Chemical Society.