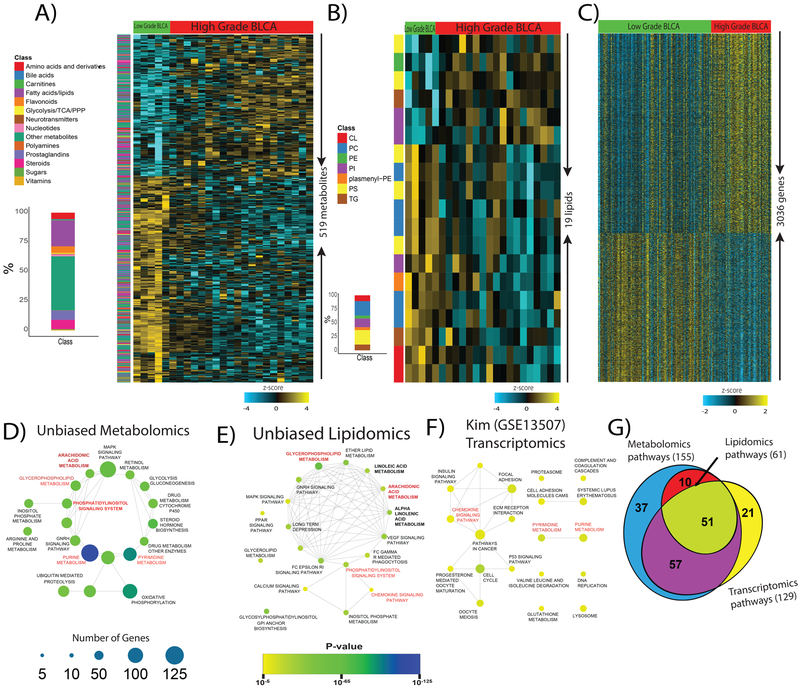
Figure 2. Identification of altered metabolites, lipids, and transcripts and their respective pathways in high-grade BLCA.
A) Heat map of hierarchical clustering of 519 differentially expressed metabolites from different classes of biomolecules detected across low-grade and high-grade BLCA samples (FDR<0.25). Each class of metabolites is represented in a different color. B) Heat map of hierarchical clustering of 19 differentially expressed lipids from various classes detected across low-grade and high-grade BLCA samples (FDR<0.25). Each class of lipids is represented in a different color. C) Heat map of hierarchical clustering of 3036 differentially expressed genes from the Kim dataset (GSE13507) across low-grade and high-grade BLCA samples (p<0.05). Columns represent individual tissue samples; rows refer to distinct metabolites, lipids, and genes. Shades of yellow indicate different levels of increase in expression; shades of blue indicate different levels of decrease in expression relative to the median levels. D, E, and F) Pathway enrichment analysis of differentially expressed metabolites, lipids, and genes shows the significantly altered pathways in high-grade BLCA (p<0.05). The node size indicates the number of genes involved in the pathway (deregulated pathways common to the metabolomics, lipidomics, and transcriptomics data sets are highlighted in red). G) Venn diagram of the deregulated metabolic pathways common to the metabolomics, lipidomics, and transcriptomics data sets.

