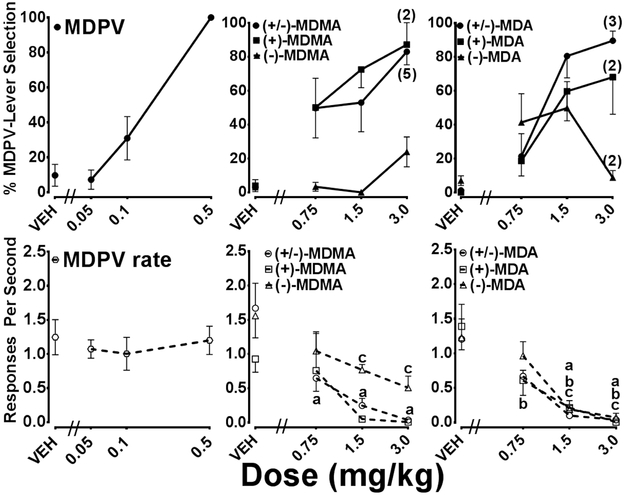
Figure 1.
Dose-response curves determined from substitution tests with MDPV, MDMA, MDA and the optical isomers of MDMA and MDA in rats trained to discriminate 0.5 mg/kg MDPV from saline. Percentage MDPV-lever selection is depicted by closed symbols in the top panel and response rate is shown as open symbols in the bottom panel. Individual data points represent the group mean (± SEM). N=7 except where noted in parentheses. Statistically significant Dunnett’s tests compared to saline (P < 0.05) are indicated by the letter a [(±)-MDMA or (±)-MDA], b [(+)-MDMA or (+)-MDA], or c [(−)-MDMA or (−)-MDA].

