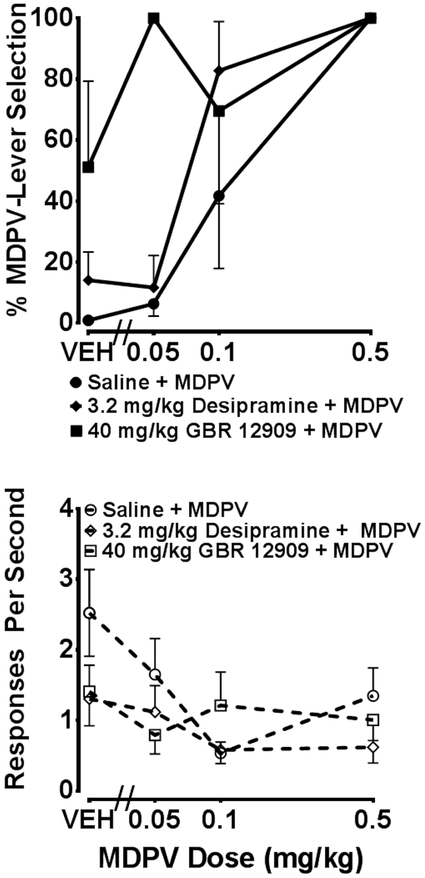
Figure 3.
MDPV dose-response curves determined with saline (n=5), 40 mg/kg GBR 12909 (n=3-4), or 3.2 desipramine (n=5) pre-treatment in animals trained to discriminate 0.5 mg/kg MDPV from saline. Percentage MDPV-lever selection is depicted by closed symbols in the upper graph and response rate is shown as open symbols in the lower graph. Individual points represent group mean (± SEM).

