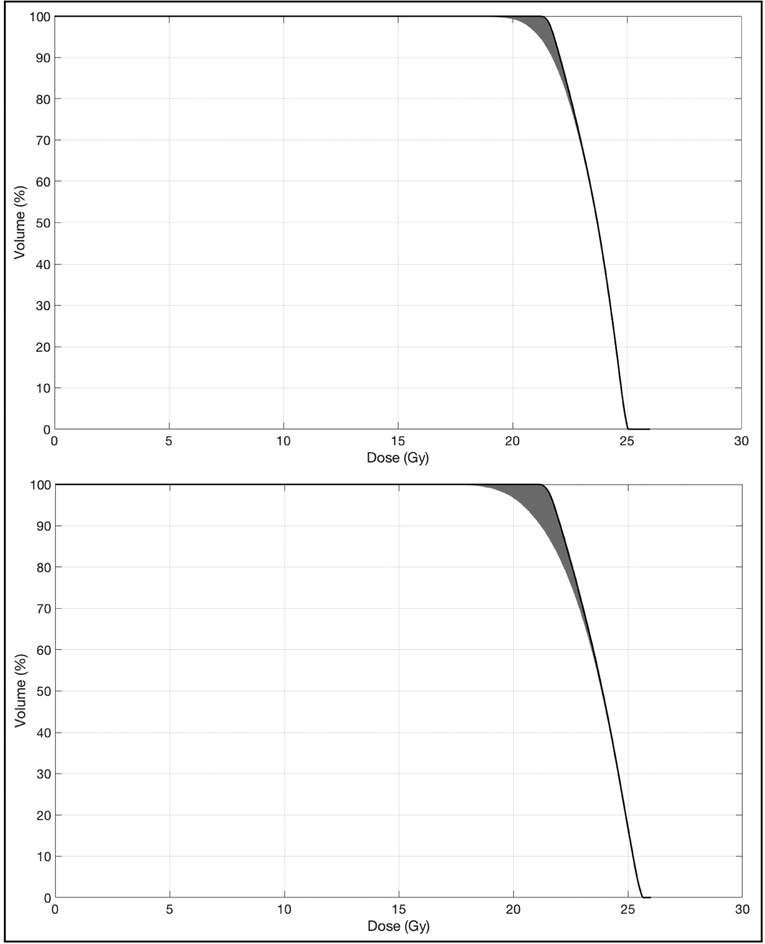
Figure 1:
Dose-volume histograms of two plans with similar static target coverage, but differing robustness. The black lines are the target DVH under the nominal dose distribution while the gray bands represent 1,000 example target DVHs that result from translations and rotations applied to the nominal plan. Prescription dose was 21 Gy.

