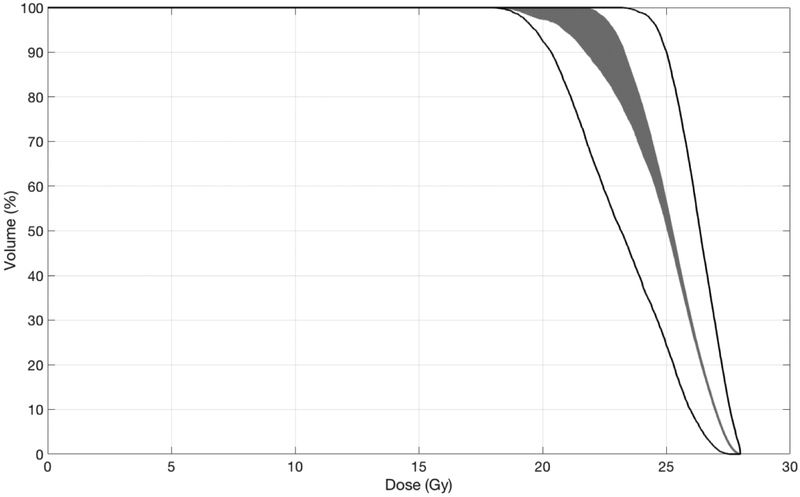
Figure 2:
Dose-volume histograms of a stereotactic radiosurgery target volume after 1,000 random rigid transformations. The large number of transformations provide a probabilistic description of the effects of errors for this example single-fraction treatment. Similar figures apply to conventionally fractionated treatments, in which case each curve will reflect an estimate of the cumulative dose delivered in one of many hypothetical treatment courses. The gray band is comprised of DVHs created from each of the 1,000 scenarios. The black lines are DVHs derived from the voxelized minimum and maximum doses. Note the discrepancy resulting from the order of determining the minimum or maximum dose and creating the DVH.

