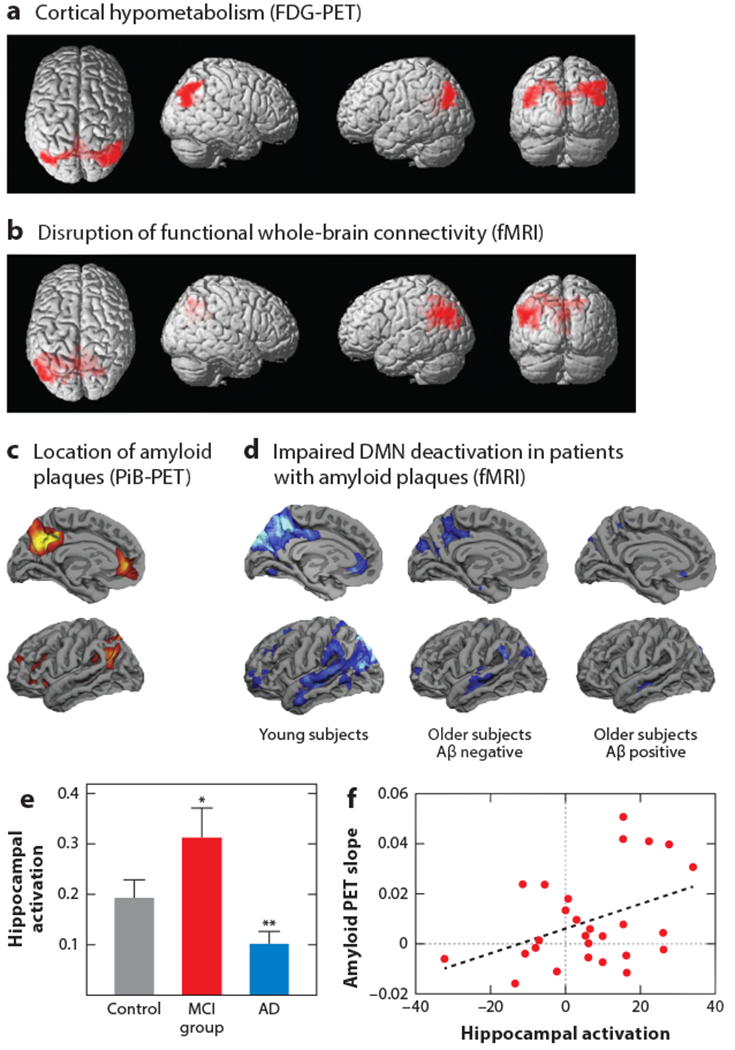
Figure 1.

Circuit disruptions in AD—evidence from human studies. (a) FDG-PET imaging reveals cortical areas with decreased glucose metabolism (red). (b) Resting-state fMRI indicates disrupted cortical hubs. Voxel-based statistical group comparisons between MCI and PiB-negative healthy controls. Panels a and b adapted from Drzezga et al. (2011) with permission from Oxford University Press. (c) Cortical distribution of Aβ plaque load in PiB-positive subjects. Group-wise comparison with PiB-negative older subjects. (d) fMRI cortical maps of task-specific DMN deactivation (blue) in young (left), older Aβ-negative (middle), and older Aβ-positive subjects (right). Panels c and d adapted from Sperling et al. (2009) with permission from Elsevier. (e) Task-related hippocampal activation is increased in the MCI group compared with controls and patients with AD. Group mean fMRI activation data; activation is reported as the number of voxels within each region of interest that shows task-specific activation (*, P < 0.03; **, P < 0.005). Panel e adapted from Dickerson et al. (2005) with permission from Wolters Kluwer. (f) Graph of the PiB-PET imaging–derived slope of Aβ plaque accumulation versus fMRI-determined hippocampal activation at baseline. Panel f adapted from Leal et al. (2017). Abbreviations: Aβ, amyloid-β; AD, Alzheimer’s disease; DMN, default mode network; FDG, fluorodeoxyglucose; fMRI, functional MRI; MCI, mild cognitive impairment; PET, positron emission tomography; PiB, Pittsburgh compound B.
