
Figure 4.
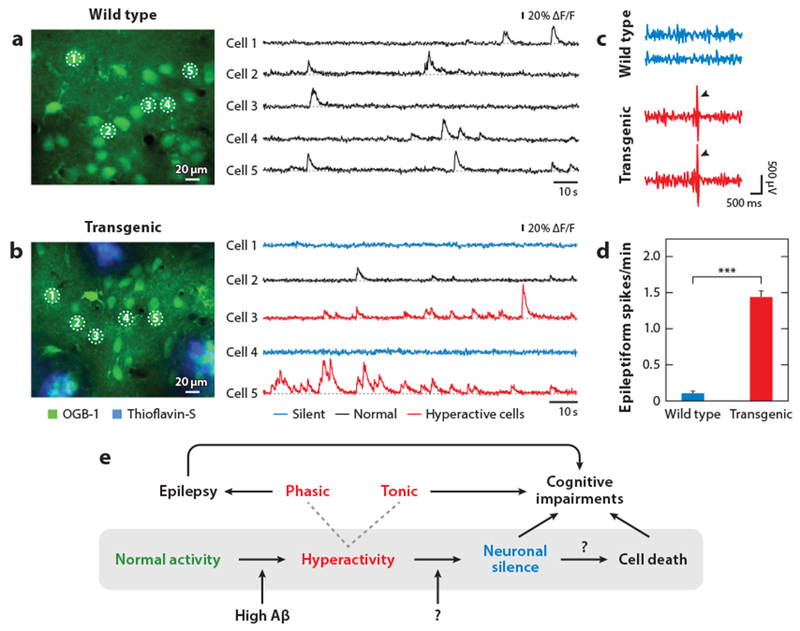
Impaired neuronal activity in mouse models of AD in vivo. (a) Two-photon calcium imaging recordings of spontaneous activity from layer-2/3 neurons (indicated as cells 1 through 5) in the frontal cortex of a wild-type mouse in vivo. The position of the neurons is indicated in the image on the left. (b) Recordings in an APP23 × PS45 transgenic mouse from a neuron with normal activity (black, cell 2), hyperactive neurons (red, cell 3 and cell 5), and silent neurons (blue, cell 1 and cell 4). In panels a and b the cortex was stained with the calcium indicator OGB-1 (green) and plaques were labeled with thioflavin-S (blue). Panels a and b adapted from Busche et al. (2008) with permission from AAAS. (c) Cortical EEG recordings from a wild-type mouse and a hAPPJ20 transgenic mouse. Arrowheads depict epileptiform spikes. (d) Epileptiform spike frequency in wild-type and transgenic mice; summary plot from panel c (***, P < 0.001). Panels c and d reprinted from Verret et al. (2012) with permission from Elsevier. (e) Schematic model indicating the sequence of events that may underlie the progression of neuronal dysfunction in AD. Reproduced from Busche & Konnerth (2015) with permission from Wiley. Abbreviations: Aβ, amyloid beta; AD, Alzheimer’s disease; APP, amyloid precursor protein; OGB-1, Oregon green-BAPTA-1; PS, presenilin-1.