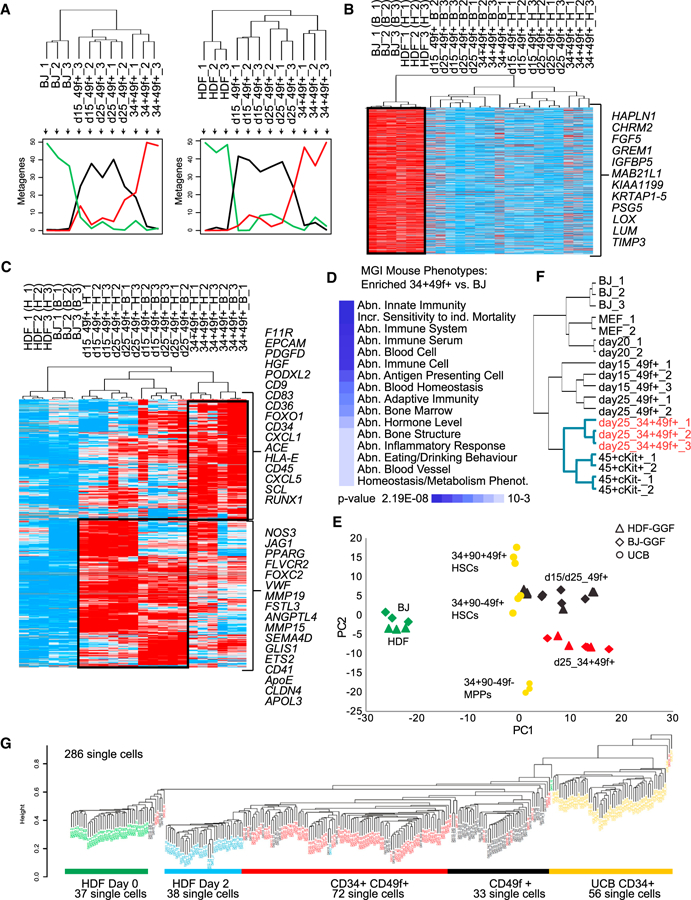
Figure 2. Dynamic Activation of Endothelial and HSPC-like Gene Expression Signatures in Reprogrammed Cells.

(A) Populations of non-transduced fibroblasts and GGF transduced day 15 CD49f+, day 25 CD49f+, and day 25 CD34+CD49f+ cells were profiled using RNA-seq (three biological replicates; samples that did not pass quality control were discarded). Ordered tree linkage displays clustering of the profiled samples and the metagenes that represent most of the variability associated with each cellular transition.
(B) Heatmap of genes expressed in fibroblasts and silenced in CD49f+ and CD34+CD49f+ cells.
(C) Heatmap of genes activated in CD49f+ and CD34+CD49f+ cells. Black boxes highlight the stage-specific expression of gene sets. Red indicates increased expression and blue decreased expression over the mean. Data were analyzed using Cluster 3.0 and displayed using Treeview.
(D) Gene list enrichment analysis with libraries from MGI mutant mouse phenotype ontology for genes upregulated from BJ to CD34+CD49f+. Heatmap shows enrichment p values.
(E) RNA-seq datasets were integrated with expression data from human UCB hematopoietic stem and progenitor cells (HSPCs) (from Notta et al., 2011). PCA shows the relative distances between samples.
(F) Hierarchical clustering integrating data from reprogrammed mouse and human cells (mouse data from Pereira et al., 2013); human CD34+CD49f+ cells highlighted in red. Blue lines highlight separate cluster for hematopoietic phenotypes.
(G) Non-supervised hierarchical clustering showing genome-wide gene expression data from HDF-derived single cells. UCB CD34+ single cells are marked in yellow. The number of single cells analyzed and phenotype are detailed.
See also Figures S3 and S4 and Tables S1, S2, and S4.
