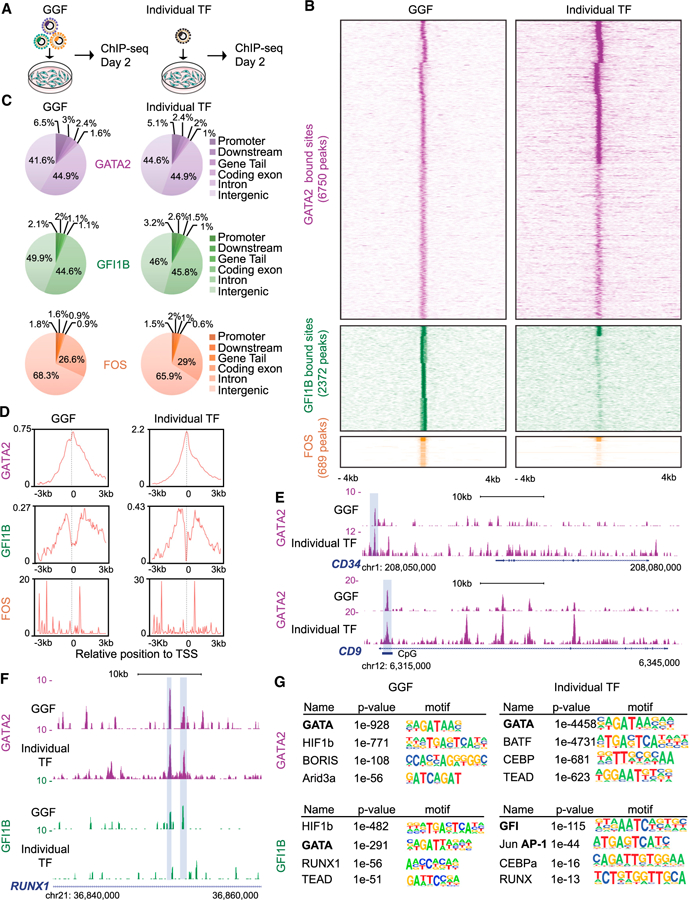
Figure 4. Analysis of TF Occupancy Reveals that GATA2 Has Both Dominant and Independent Targeting Capacity.

(A) Strategy for identifying GGF genomic binding sites. GGF factors were transduced in combination (left) or individually (right) and analyzed using ChIP-seq 2 days after adding Dox.
(B) Heatmaps representing genome-wide occupancy profile for GGF factors when expressed in combination or individually in HDFs. For each site, the signal is displayed within an 8 kb window centered on individual peaks.
(C) Genomic distribution of GGF and individual transcription factor (TF) peaks in transduced HDFs.
(D) ChIP-seq read density relative to transcription start site (TSS). The graph shows a plot of the average read coverage per million mapped reads centered to the TSS.
(E) Genome browser profiles illustrating GATA2-binding sites at CD34 and CD9 loci. The y axis represents the total number of mapped reads. The boxes highlight shared peaks when GATA2 is expressed individually or in combination with GFI1B and FOS.
(F) GATA2 and GFI1B occupancy profile at the RUNX1 locus. The boxes highlight shared peaks between GATA2 and GFI1B only when expressed in combination. The genomic scale is in kilobases.
(G) De novo motif prediction for GATA2 and GFI1B target sites when expressed in combination or individually. The motifs for GATA, GFI, and AP-1 factors are bolded.
