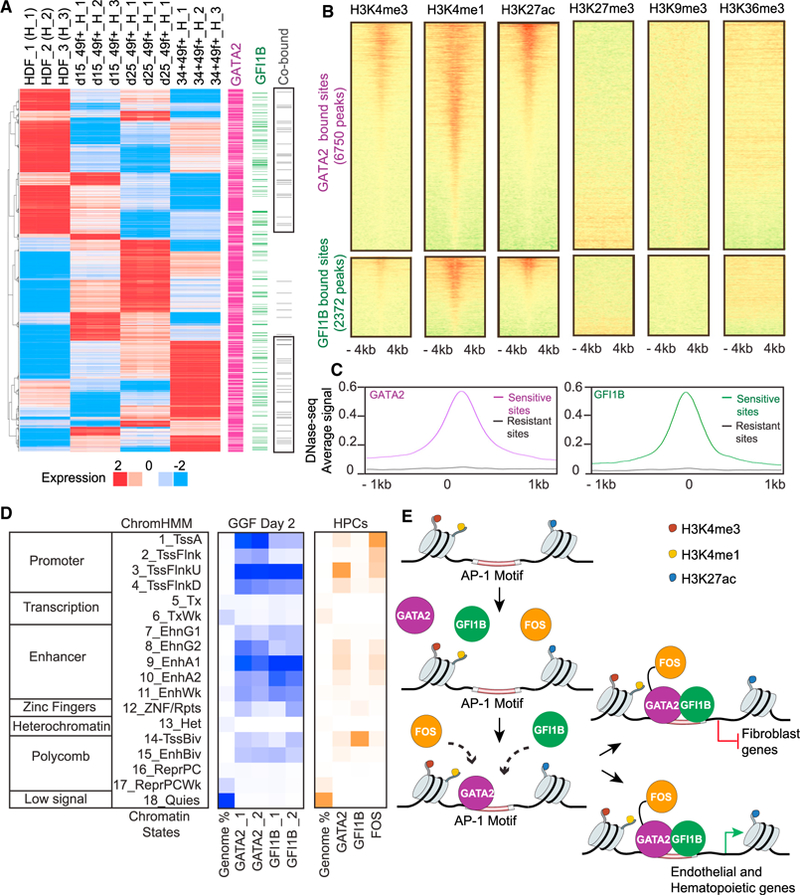
Figure 6. GATA2 and GFI1B Engage Open Promoters and Enhancer Regions.

(A) Integration of RNA-seq and ChIP-seq datasets. The heatmap (left) shows 1,425 genes with at least 1.5-fold expression changes across the dataset. Genes were identified as targets of GATA2 (purple) or GFI1B (green), with co-bound targets in gray (right), on the basis of binding peaks within the range of a 10 kb window centered on the transcriptional start site.
(B) Heatmaps of normalized tag densities representing HDF chromatin marks at GATA2 and GFI1B target sites. The signal is displayed within an 8 kb window centered on the binding sites.
(C) Average DNase-seq signal of HDFs at GATA2 and GFI1B target sites. The signal is displayed within a 2 kb window.
(D) Heatmaps for chromatin-state functional enrichment. Rows represent chromatin states according to ChromHMM annotation: TssA, active promoters; TssFlnk, flanking promoters; TssFlnkU, flanking upstream promoters; TssFlnkD, flanking downstream promoters; Tx, strong transcription; TxWk, weak transcription; EnhG1/2, genic enhancers; EnhA1/2, active enhances; EnhWk, weak enhancers; ZNF/Rpts, ZNF genes and repeats; Het, heterochromatin; TssBiv, bivalent/poised TSS; EnhBiv, bivalent enhancer; ReprPC, repressed PolyComb; ReprPCWk, weak repressed PolyComb; Quies, quiescent. Blue panel shows the percentage of genome occupancy for GATA2 and GFI1B in GGF-transduced HDFs. Orange panel shows the percentage of genome occupancy for GGF in human hematopoietic progenitor cells (HPCs).
(E) Model of the mechanism of action of GGF during hemogenic induction in human fibroblasts.
