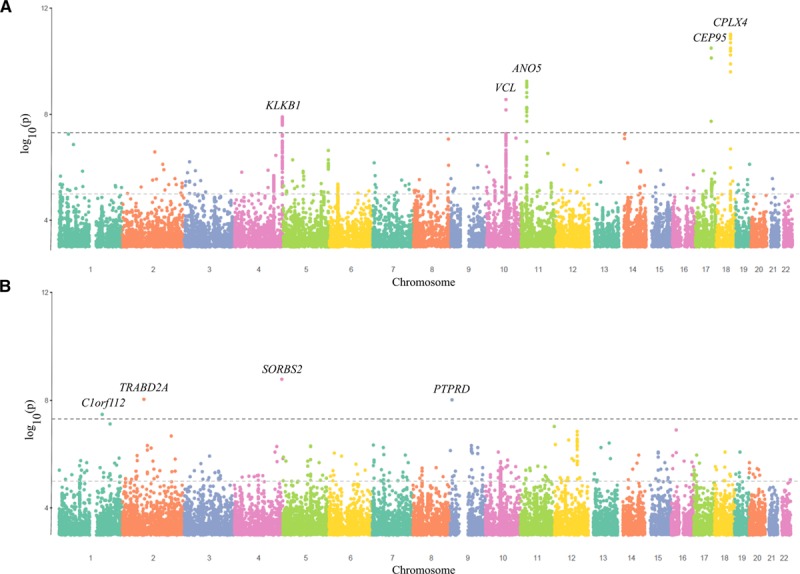
Figure 3.

Manhattan plots for single-nucleotide polymorphisms associated with cTnI and cTnT after adjustment for age and sex (n=19 130). A, cTnI. B, cTnT. The horizontal black dotted line indicates genome-wide significance at P<5×10⁻⁸, and the horizontal gray dotted line suggests significance at P<1×10⁻⁵.
