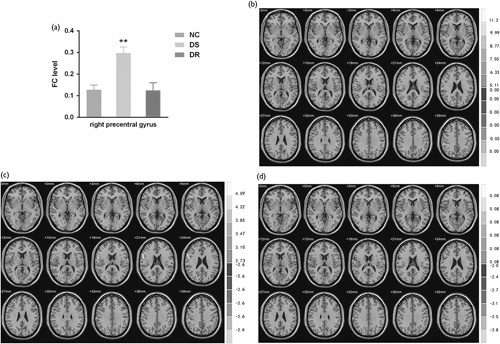
Fig. 1.

Differences in the functional connectivity (FC) levels of the right hippocampus among groups. (a) Statistical comparison of FC toward the right precentral gyrus among the control, drug-sensitive (DS), and drug-resistant (DR) groups. The DS group, but not the DR group, had a significantly enhanced FC level compared to the normal control (NC) group. There was a highly significant difference between the two GTCS groups. (b) Regions with differential FCs from the right hippocampus among the three groups; (c) FC between the right hippocampus and the right precentral gyrus was enhanced in the DS group versus controls; (d) FC between the right hippocampus and the right precentral gyrus was attenuated in the DR group versus the DS group. **P<0.01 versus the NC or DR groups.
