
Figure 3.
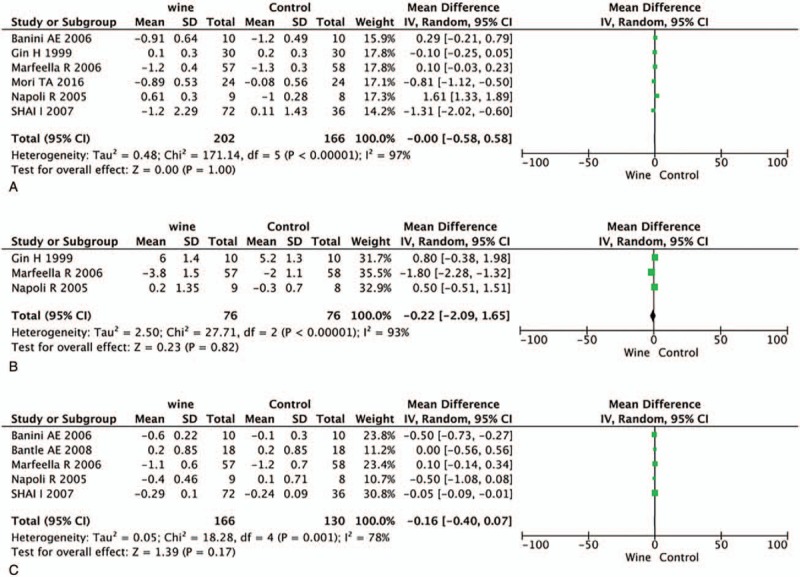
Forest plot of fasting glucose (A), insulin (B) and HbAc1% (C), when comparing red wine with control. HbA1c = glycated hemoglobin.
Official websites use .gov
A
.gov website belongs to an official
government organization in the United States.
Secure .gov websites use HTTPS
A lock (
) or https:// means you've safely
connected to the .gov website. Share sensitive
information only on official, secure websites.
Forest plot of fasting glucose (A), insulin (B) and HbAc1% (C), when comparing red wine with control. HbA1c = glycated hemoglobin.