
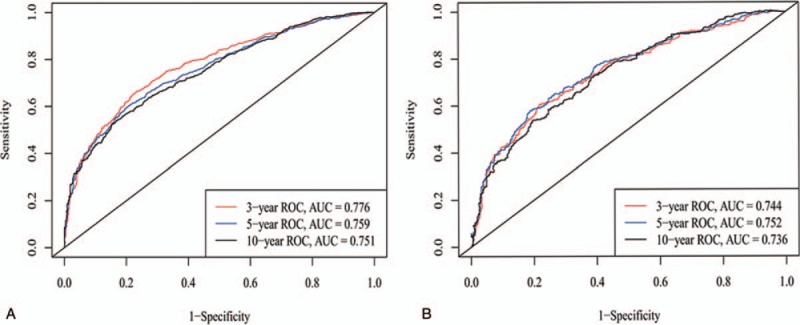
Figure 3.
ROC curves. ROC curve analyses were generated to test the performance evaluating of the newly established nomogram, by the areas under the ROC curves (AUC), a came from the training set, and b came from the validation set.
Official websites use .gov
A
.gov website belongs to an official
government organization in the United States.
Secure .gov websites use HTTPS
A lock (
) or https:// means you've safely
connected to the .gov website. Share sensitive
information only on official, secure websites.
ROC curves. ROC curve analyses were generated to test the performance evaluating of the newly established nomogram, by the areas under the ROC curves (AUC), a came from the training set, and b came from the validation set.