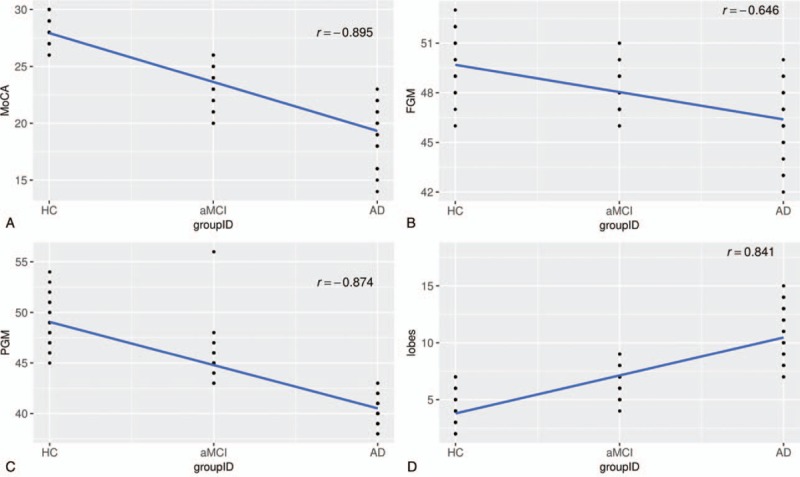
Figure 3.

(a–d) Scatter plots with regression line and correlation for comparing different MoCA values (a), FGM values (b), PGM values (c), and average numbers of hemorrhage in regions of lobes (d) among 3 groups. FGM = frontal gray matter, MoCA = Montreal cognitive assessment, PGM = parietal gray matter.
