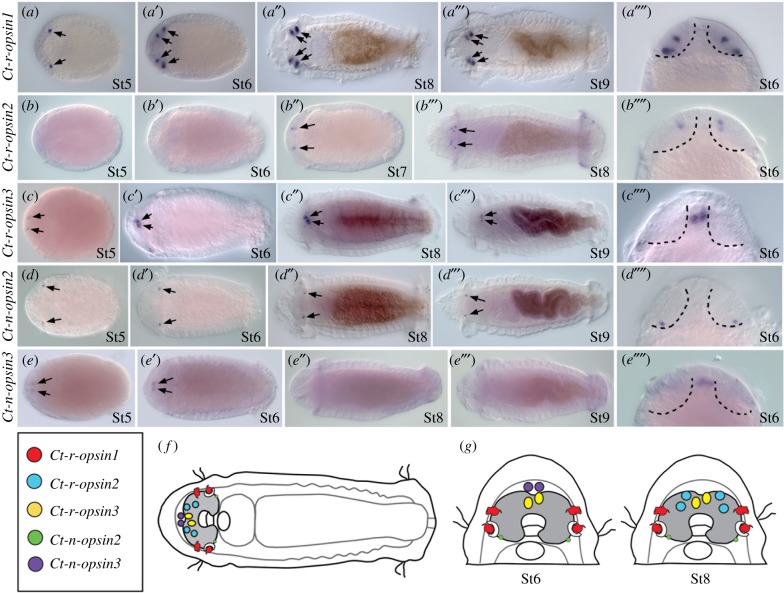
Figure 2.
Expression of opsin genes in the larval brain region and eyespot sensory cells. (a – e′′′′) Expression patterns of opsin genes by in situ hybridization during larval development. Arrows indicate expression. All panels are ventral views. Stages are indicated in bottom right corner and follow the staging system of [20]. (a–e′′′) Anterior is to the left. (a′′′′–e′′′′) Enlarged views of head. Brain lobes are indicated by dotted lines. Anterior is to the top. Brain is shaded in (f) and (g). (a–a′′′′) Ct-r-opsin1, (b–b′′′′) Ct-r-opsin2, (c–c′′′′) Ct-r-opsin3, (d–d′′′′) Ct-n-opsin2, (e–e′′′′) Ct-n-opsin3. (f) Schematic of a stage 7 larva, showing localization of opsin expression domains to the head. Each gene is represented by a distinct colour (see key). (g) Schematics showing magnified views of larval heads (stages 6 and 8) to highlight the spatial relationships among opsin gene expression patterns. (Online version in colour.)

