Figure 3.
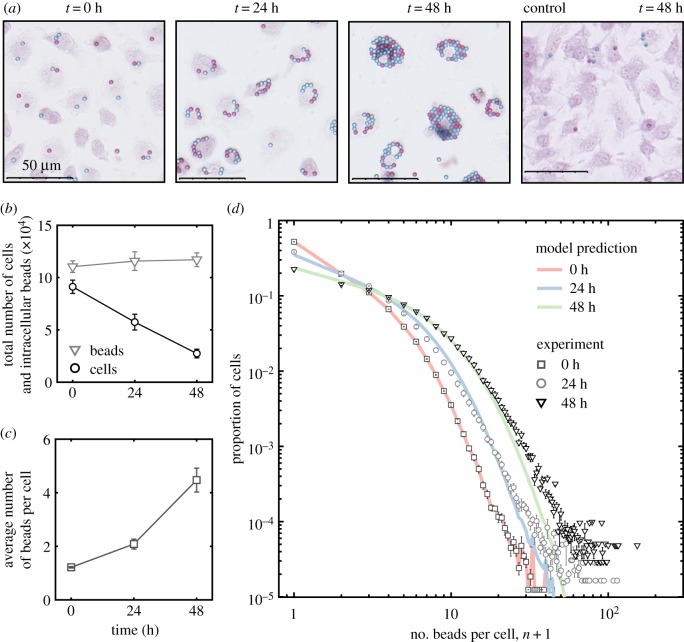
Bead accumulation in M1 macrophages. Quantification of red and blue beads inside safranin-stained murine bone marrow-derived macrophages (BMDMs) following stimulation with IFNγ and LPS. The data presented are averaged from four experiments carried with BMDMs derived from different mice on different days. Initially, there were approximately 9 × 10⁴ cells that collectively contain 11 × 104 beads. (a) Representative images of BMDMs at 0, 24 and 48 h after stimulation. Also shown is a representative image of unstimulated BMDMs at 48 h (far right). (b) The total number of BMDMs (black circles) and the total number of intracellular beads (grey triangles) over time. (c) The average number of beads per cell over time. (d) The proportion of BMDMs with number n beads per cell prior to stimulation (dark grey squares) and 24 (light grey circles) and 48 (black triangles) hours after stimulation. Also shown are predictions from the mathematical model (no cell division) run from the experimental initial condition (red line and black squares) with death rate 1/60 h−1 to 24 (blue line) and 48 (green line) hours; the distribution have R-squared values R2 = 0.9929 and R2 = 0.9970 with the experimental distributions at 24 h at 48 h, respectively. (Online version in colour.)

