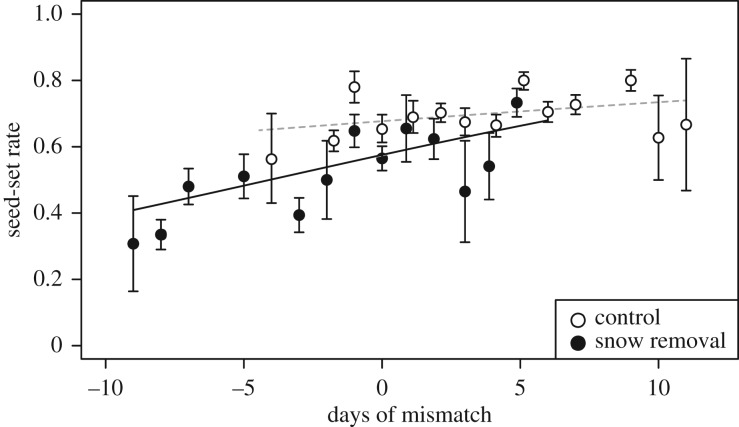
Figure 3.
The relationship between phenological mismatch and seed-set rates of individual plants in the control (open circles and dashed line) and snow removal treatments (closed circles and solid line). Mean ± s.e. Data during the experimental period (2014–2017) are pooled. A logistic regression curve is indicated separately for each treatment.

