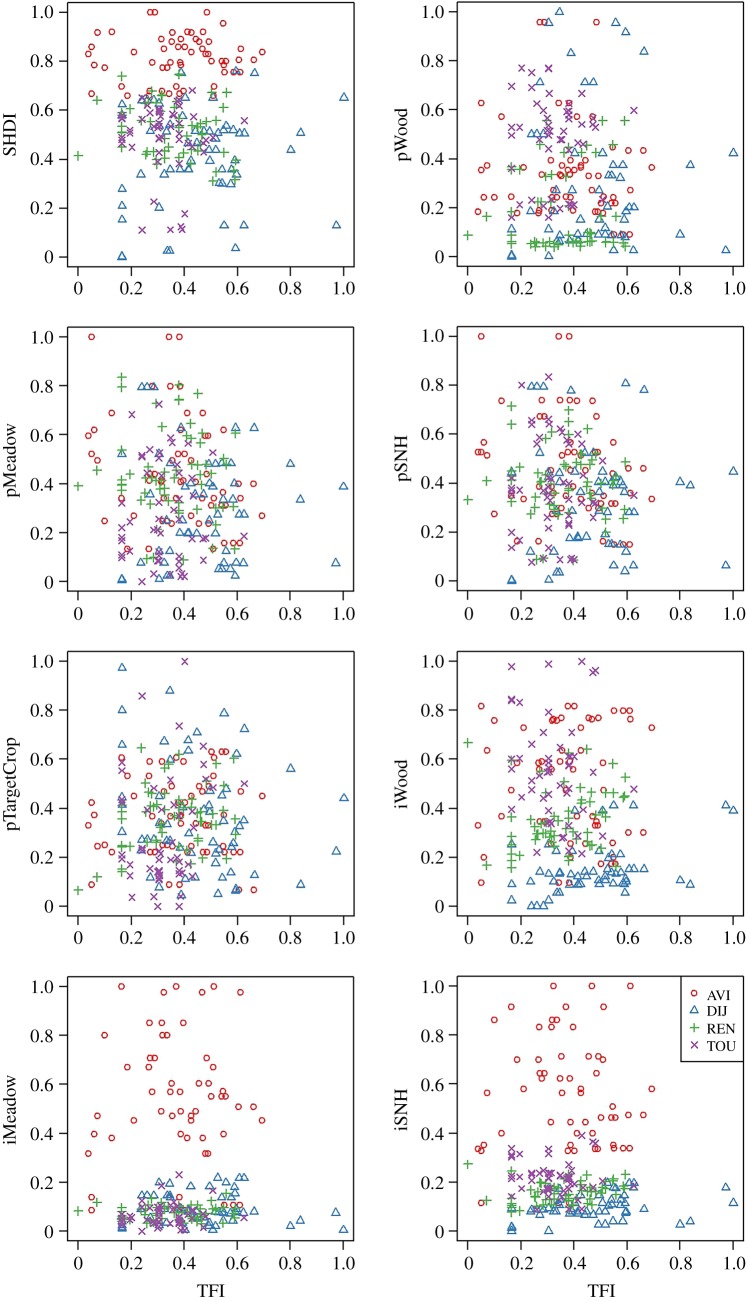
Figure 1.
Distribution of the data for each region (AVI, Avignon; DIJ, Dijon; REN, Rennes; TOU, Toulouse). SHDI, Shannon diversity index of land cover types; pWood, proportion of woody elements; pMeadow, proportion of meadows; pSNH, proportion of semi-natural habitats; pTargetCrop, proportion of crops similar to that of the monitored field; iWood, length of crops/woods interfaces; iMeadow, length of crops/meadows interfaces; iSNH, length of crops/semi-natural habitats interfaces (TFI normalized per crop type and then scaled between 0 and 1 over the whole dataset; landscape variables scaled between 0 and 1 over the whole dataset). (Online version in colour.)

