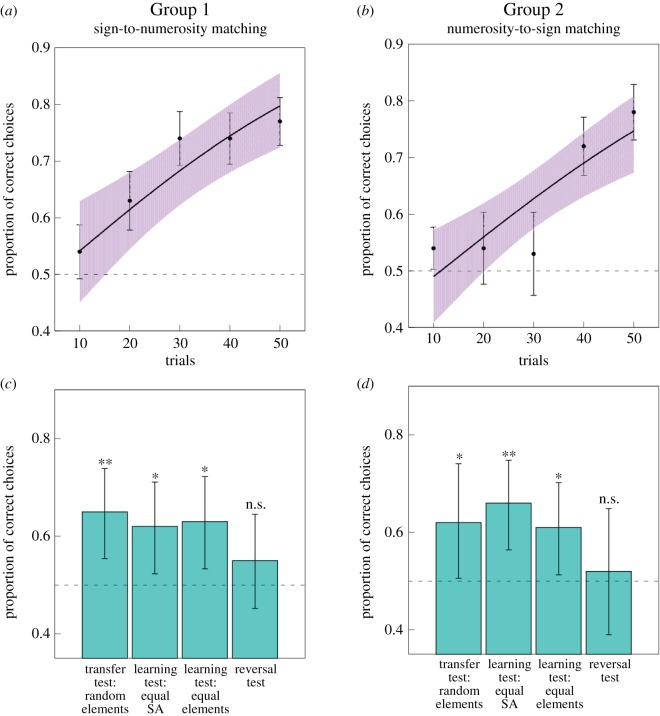
Figure 3.
Results of the training and testing phases for the (a) group of bees trained to match a sign with a quantity (Group 1; n = 10) and for the (b) group of bees trained to match a quantity with a sign (Group 2; n = 10). (a,b) Performance during the training phase for (a) Group 1 and (b) Group 2. Dashed line at 0.5 indicates chance level performance. Solid black line represents a function describing the training phase of n = 10 bees as modelled by a generalized linear mixed model (GLMM). Points (closed circles) along the curve indicate the observed mean ± 95% CIs (shaded area) of correct choices for the bees. Increase in performance during the training phase was significant. (c,d) Performance during the testing phases for both (c) Group 1 and (d) Group 2. n = 10 for both test groups. Dashed line at 0.5 indicates chance level performance. Significance from chance level performance is indicated by * ≥ 0.05, ** ≥ 0.01, *** ≥ 0.001, n.s. > 0.05. Data shown are means ± 95% CI boundaries for all tests. See the electronic supplementary material, figure S2 for the individual learning curves obtained during training and proportion of correct choices per bee in the test phases. (Online version in colour.)

