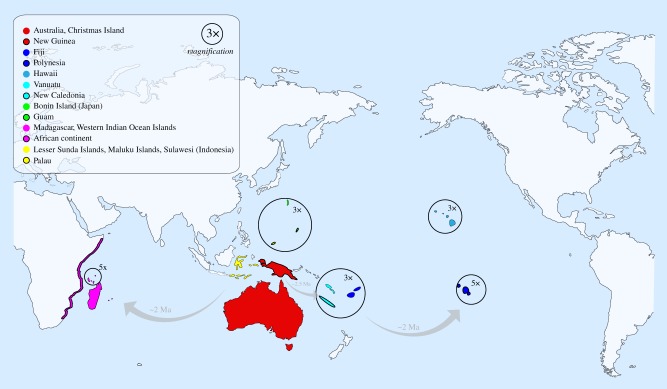
Figure 2.
Distribution map of the genus with the 17 geographical regions used in the biogeographic analyses. The colours and outlines of each region match with the orbs that highlight the geographical region of origin for each species (figure 1). Five geographical regions have been magnified to improve visualization, while regions within the Indonesian and Malagasy archipelagoes have been combined to improve clarity (though each of these regions were used independently in biogeographical models).

