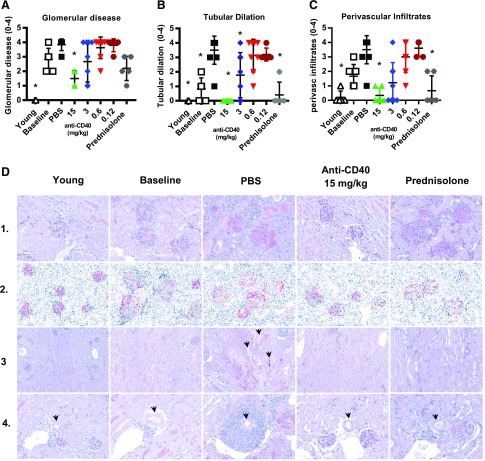
FIGURE 6.
Therapeutic treatment with anti-CD40 mAb 201A3 reduced kidney glomerular disease, tubular dilation, and perivascular disease. (A–C) Kidney histological analysis of glomerular disease, tubular dilation, and perivascular infiltrates for animals treated for a minimum of 4 wk. Scoring system is described for each in the Materials and Methods. *p < 0.05 Kruskal–Wallis test versus PBS controls. For (C), the 15 mg/kg anti-CD40 and prednisolone groups are not different statistically from the young prediseased group. Numbers of mice per group: young (n = 5); baseline (n = 6); PBS (n = 6); prednisolone (n = 5); and anti-CD40 at 15, 3, 0.6, and 0.12 mg/kg (n = 6, 9, 8, and 5, respectively) mean values ± SD. (D) Representative images of the kidney of mice from the indicated cohorts. All images are at original magnification ×40. Row 1, PAS staining to assess extracellular matrix deposition in and around the glomeruli; row 2, Podoplanin staining to reveal the glomeruli; row 3, PAS stain to reveal the tubules (indicated by arrowheads). Many tubules are open space and appear white, whereas others are filled with protein and stain pink; row 4, PAS staining of sections for IBA1 (red) and CD3 (black) showing inflammation around arcuate arteries (identified by arrowheads).

