. 2019 May 28;11(2):189–195. doi: 10.4274/jcrpe.galenos.2019.2019.0009
©Copyright 2019 by Turkish Pediatric Endocrinology and Diabetes Society | The Journal of Clinical Research in Pediatric Endocrinology published by Galenos Publishing House.
This is an open-access article distributed under the terms of the Creative Commons Attribution License, which permits unrestricted use, distribution, and reproduction in any medium, provided the original work is properly cited.
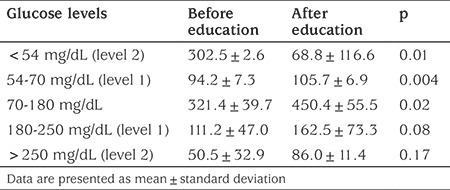
Table 2. Area under the curve per 24 hours (mg/dL x day).

