Figure 1.

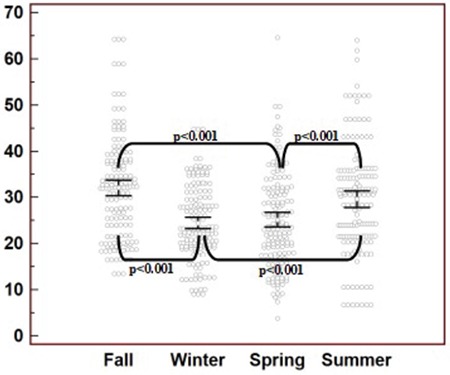
Distribution of 25(OH)D in different seasons. The y axis represents the 25(OH)D levels and their seasonal distribution. Significant differences were depicted with conjuncted lines between the seasons using p values

Distribution of 25(OH)D in different seasons. The y axis represents the 25(OH)D levels and their seasonal distribution. Significant differences were depicted with conjuncted lines between the seasons using p values