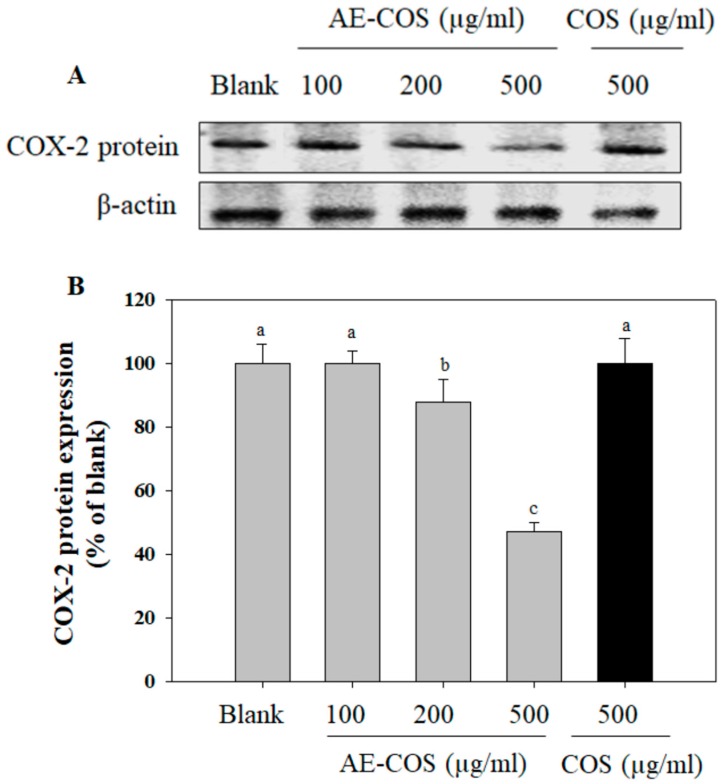
Figure 2.
The suppressive effect of AE-COS on COX-2 protein expression in A549 cells. The cells were treated with various concentrations of AE-COS for 24 h. (A) The level of COX-2 protein expression was determined by Western blot analysis. The β-actin was used as internal control. Blank: No addition of AE-COS. (B) Densitometrically calculated expression level of COX-2 was given as a percentage compared to the blank group. Each determination was made in triplicate, and the data were expressed as means ± SD. If two groups have different letters, they are significantly different from each other at p < 0.05. Blank is absent AE-COS or COS.

