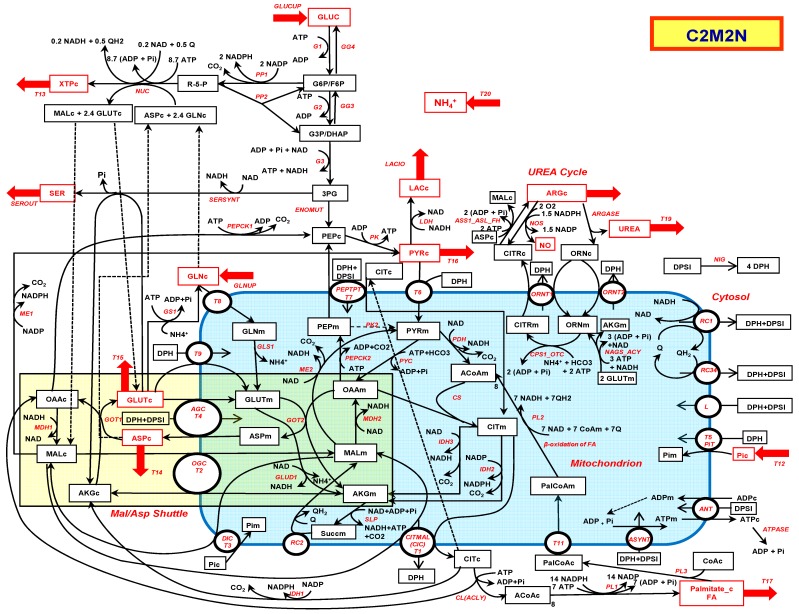
Figure 1.
The central carbon metabolic with nitrogen model (C2M2N). Possible entries and outputs are indicated by red arrows. The corresponding metabolites are in red. The abbreviated names of the reactions are indicated in red italic along the arrows of the reactions. The mitochondrion is in blue and the malate–aspartate shuttle in light brown. Dotted lines link identical metabolites duplicated for the sake of presentation.

