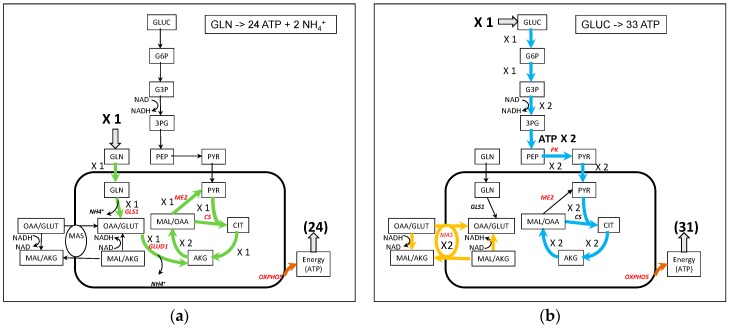
Figure 2.
A simplified representation of ATP synthesis from glutamine (a) and glucose (b). Note that in (b), for the sake of simplicity, the representation of MAS has been separated from the TCA cycle although they share the MDH2 activity with a net flux of 4, 2 for MAS and 2 for the TCA cycle. The complete figures of the fluxes are in Figure S2.

