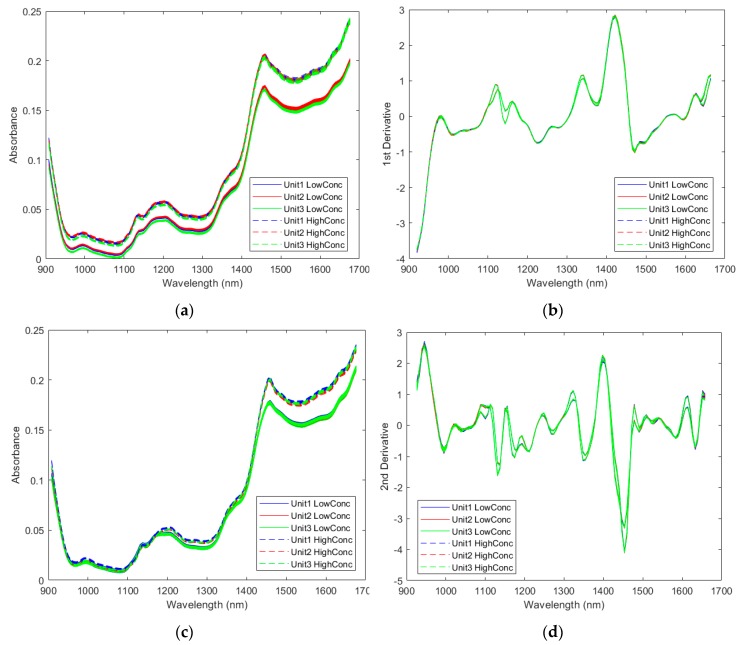
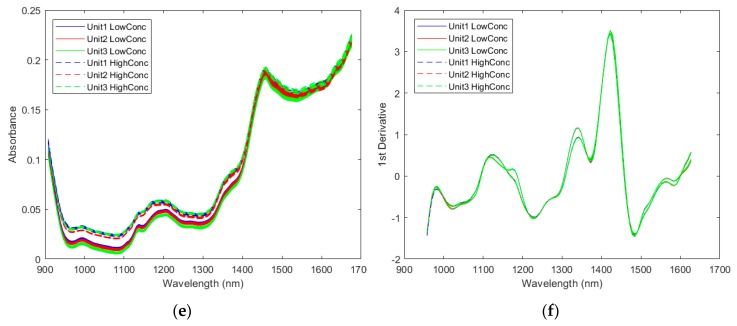
Figure 2.
Spectra of samples with the highest and the lowest active pharmaceutical ingredient (API) concentrations measured by three instruments: (a) selected raw spectra based on the acetylsalicylic acid (ASA) concentration; (b) selected preprocessed spectra based on the ASA concentration by Savitzky-Golay 1st derivative (5 smoothing points and 2nd polynomial order) and SNV; (c) selected raw spectra based on the ascorbic acid (ASC) concentration; (d) selected preprocessed spectra based on the ASC concentration by Savitzky-Golay 2nd derivative (7 smoothing points and 3rd polynomial order) and SNV; (e) selected raw spectra based on the caffeine (CAF) concentration; (f) selected preprocessed spectra based on the CAF concentration by Savitzky-Golay 1st derivative (17 smoothing points and 3rd polynomial order) and SNV.


