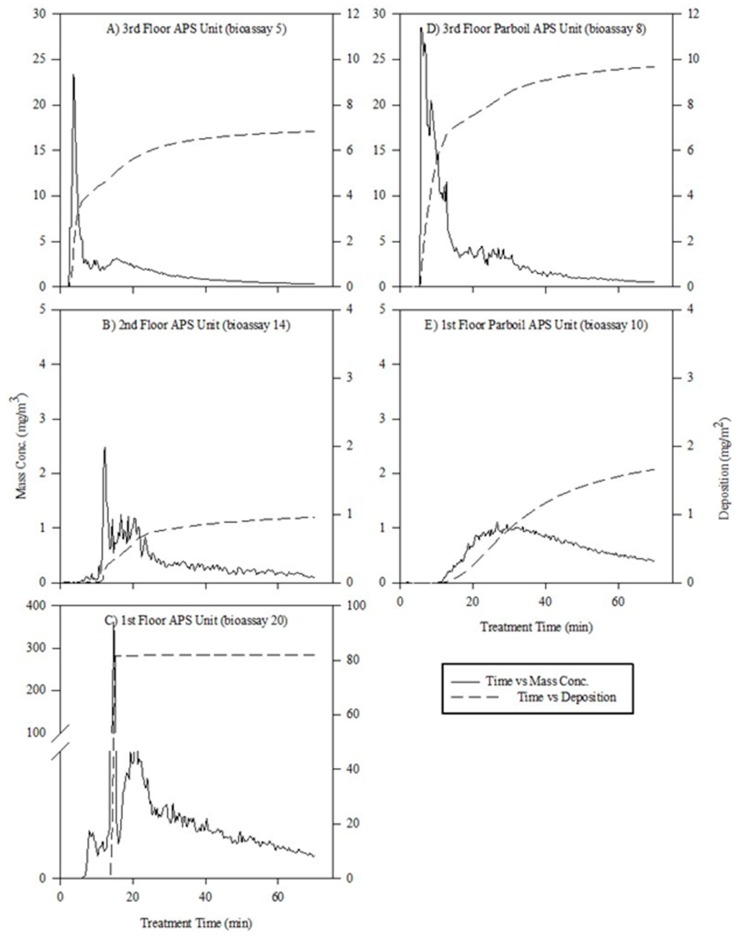
Figure 5.
A comparison of the mass concentration (mg/m3, left y-axis, solid line) and estimated particle deposition (mg/m2, right y-axis, dashed line) during the aerosol treatment time (x-axis). Data is from (A) Aerodynamic Particle Sizer Spectrometers (APS) unit located on the third floor of the milling facility; (B) APS unit located on the second floor of the milling facility; (C) APS unit located on first floor of the milling facility; (D) APS unit located on the third floor of the parboil facility; and (E) APS unit located on the first floor of the parboil facility.

