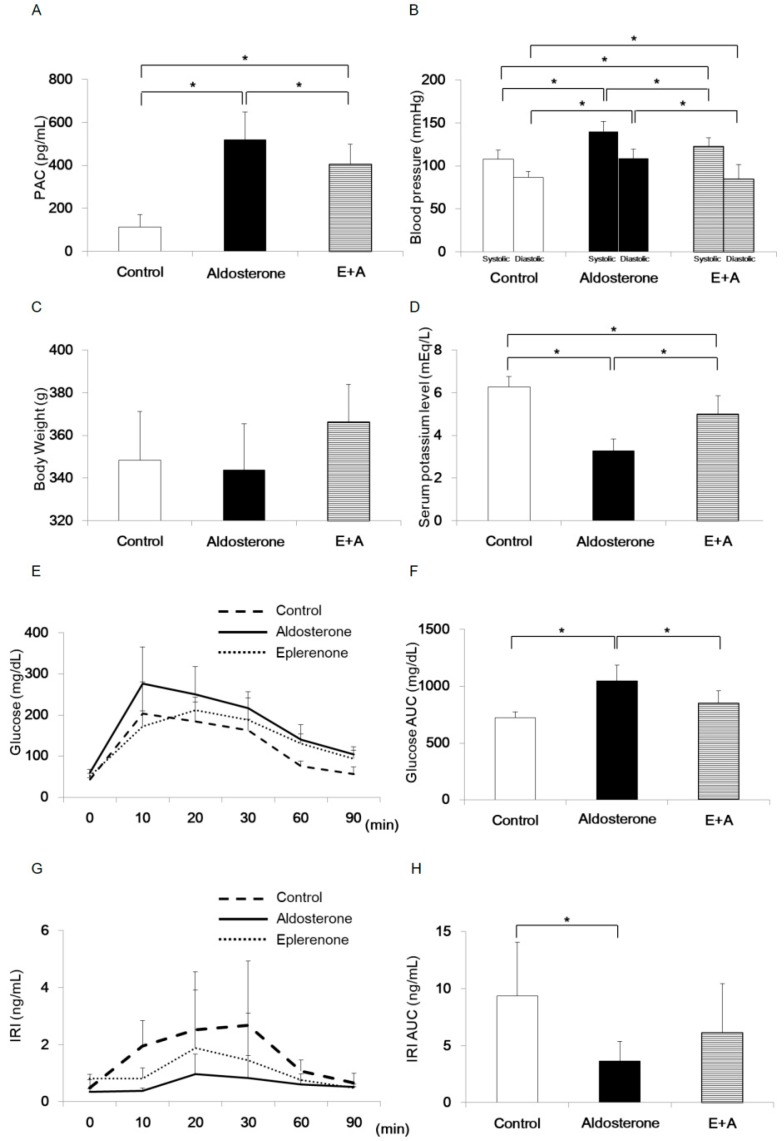
Figure 1.
Comparisons of each parameter in primary aldesteronism (PA) model rodents on day 28. Rats were randomized into three treatment groups (n = 6 each group): control, treated with vehicle; aldosterone, treated with 2.9 mg/mL d-aldosterone; and E+A, treated with d-aldosterone and 100 mg/kg/day oral eplerenone administration. (A) Plasma aldosterone concentration of each treatment group. (B) Blood pressure value of each treatment group. (C) Body weight value of each treatment group. (D) Serum potassium level of each treatment group. (E) Blood glucose concentration during intraperitoneal glucose tolerance test (ipGTT) (2 g/kg) of each treatment group. (F) Area under the curve (AUC) of blood glucose concentration during ipGTT of each treatment group. (G) Immunoreactive insulin (IRI) concentration during ipGTT (2 g/kg) of each treatment group. (H) AUC of IRI during ipGTT of each treatment group. * p < 0.05. Data are shown as mean ± SE.

