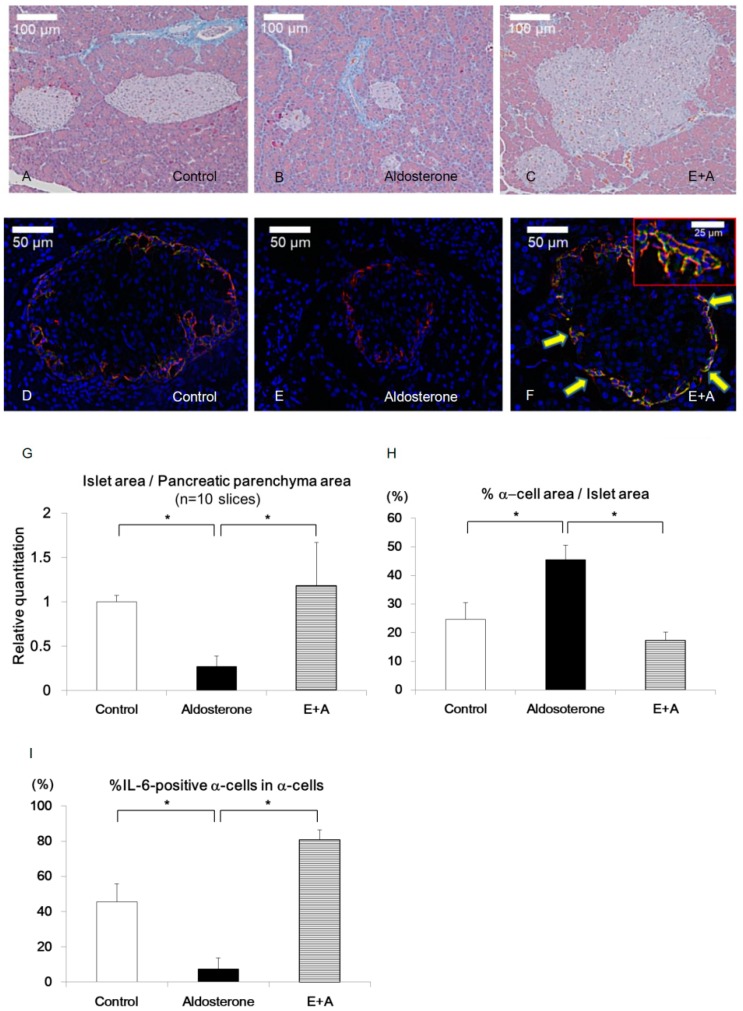
Figure 2.
Histological analysis of pancreatic islets in PA model rodents. (A–C) Masson’s trichrome staining of the islets of each treatment group. (D–F) Double staining of glucagon (red) and IL-6 (green) of the islets of each treatment group. Arrows in F indicate IL-6-positive staining in α-cells. (G) Islet/pancreatic parenchyma area ratio of each group (n = 10 slices). (H) Percentages of α-cells area in islet area. (I) Percentages of IL-6-positive α-cells in α-cells. Scale bars in (A–C) = 100 μm and scale bars in (D–F) = 50 μm. * p < 0.05. Data are shown as mean ± SE.

