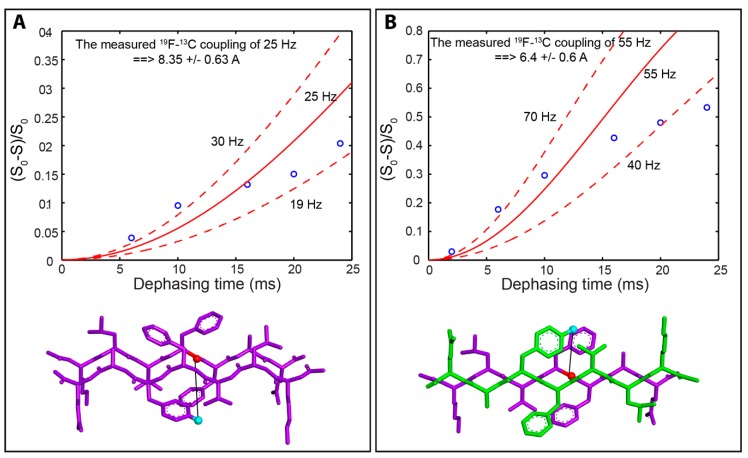
Figure 5.
Dephasing curves for measurement of 19F-13C distance correlations: ((A). Dephasing curve depicted as ∆S/S0 vs. dephasing time (ms) used to determine the 1-13C to 19F distance in pleated β-sheet cofibrils of l-Ac-KLVFFAE-NH2 with l-Ac-KLVF(4-F-Phe)AE-NH2. At the bottom of the panel is a predictive model for the cross-strand β-sheet orientation of these peptides with the 1-13C label shown in red and the 19F label shown in cyan. The predicted 19F-13C distance is 8.63 Å and the measured 19F-13C distance is 8.4 Å. (B) Dephasing curve depicted as ∆S/S0 vs. dephasing time (ms) used to determine the 1-13C to 19F distance in rippled β-sheet cofibrils of l-Ac-KLVFFAE-NH2 with d-Ac-klvf(4-F-phe)ae-NH2. At the bottom of the panel is a predictive model for the cross-strand β-sheet orientation of these peptides in rippled β-sheets with the 1-13C label shown in red and the 19F label shown in cyan. The predicted 19F-13C distance is 6.48 Å and the measured 19F-13C distance is 6.4 Å.

