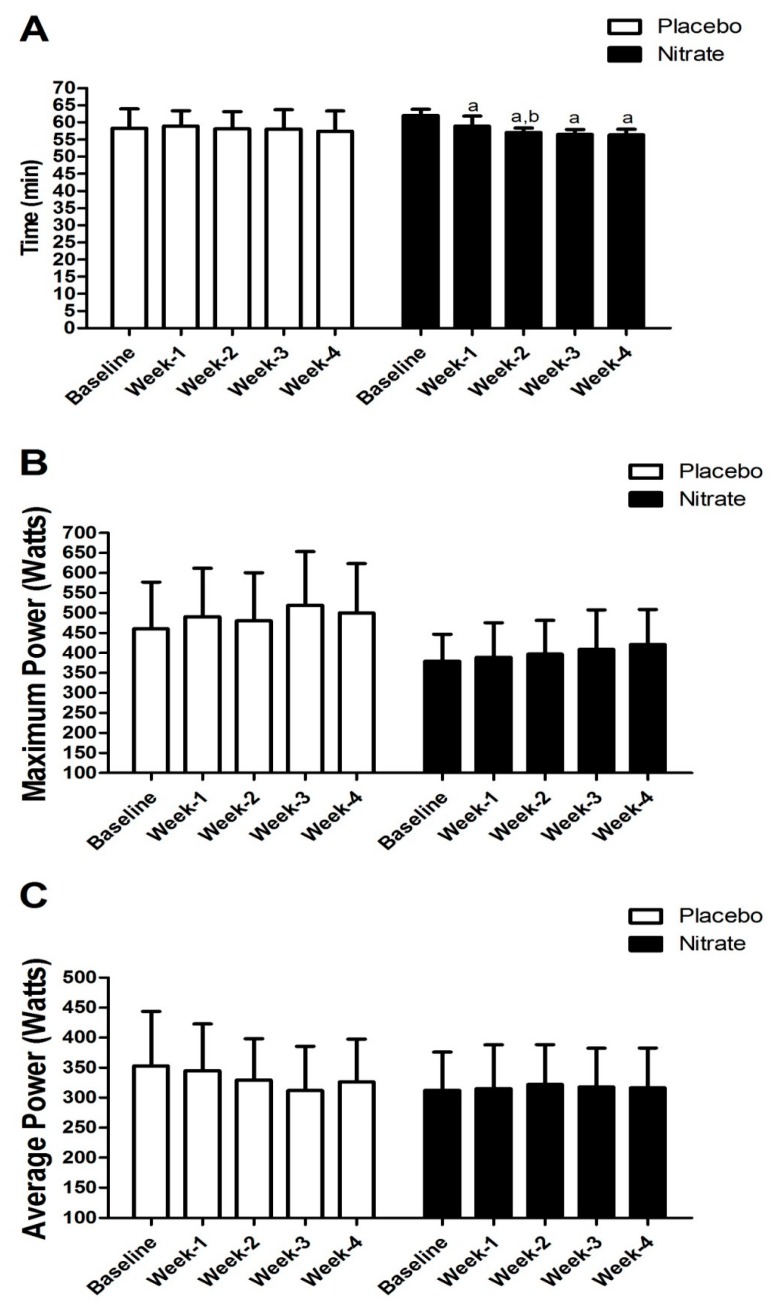
Figure 1.
Comparison between placebo and nitrate groups for the time to complete the 10-km running time trials (panel 1-A), and maximum (panel 1-B) and average (panel 1-C) power developed during the Wingate test performed weekly during the training program. a is Bonferroni’s test result with p < 0.05 compared to baseline; b is Bonferroni’s test result with p < 0.05 compared to week 1.

