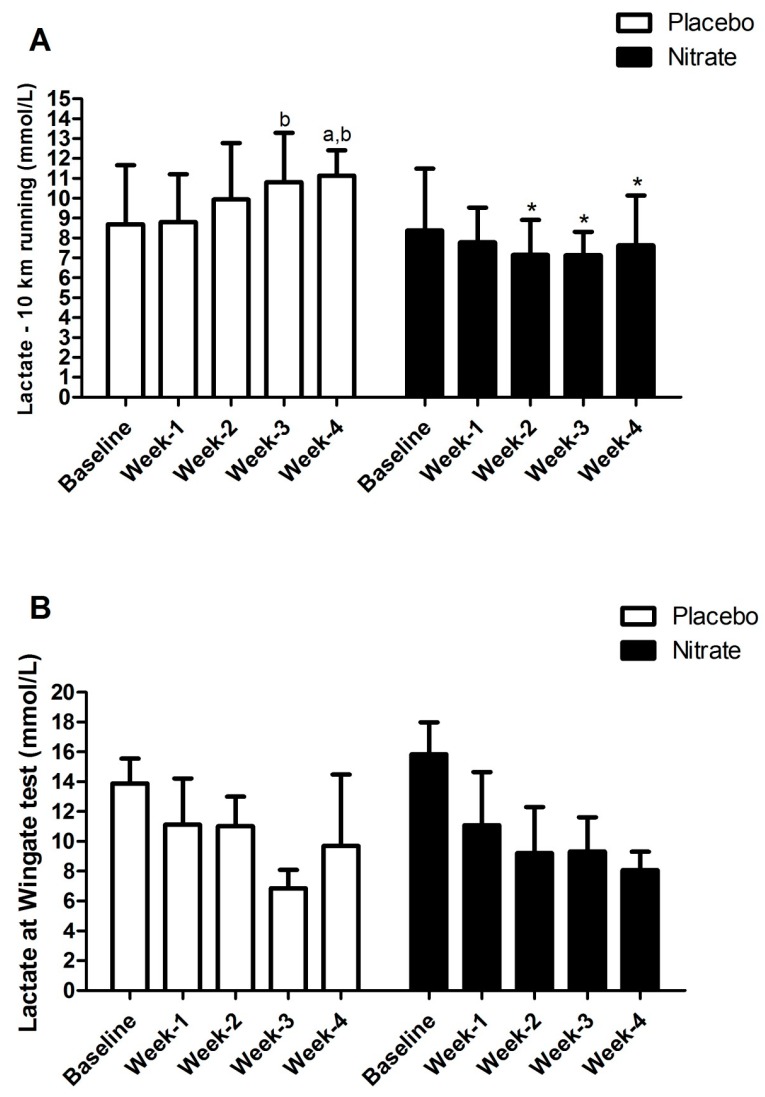
Figure 2.
[La−] after the 10-km running time trial (TT) (panel 2-A) and the 60-s Wingate test (panel 2-B) for placebo and nitrate group. a is Bonferroni’s test result with p < 0.05 compared to baseline; b is Bonferroni’s test result with p < 0.05 compared to week-1; (*) Bonferroni’s test result with p < 0.05 compared to Placebo.

