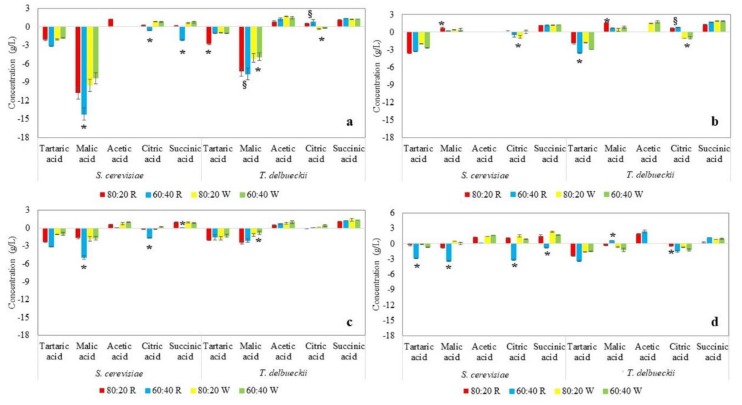
Figure A1.
Evolution of organic acids (g/L) at the end of fermentations for the drinks produced in the flask experiment for (a) cherry, (b) kiwi, (c) peach, and (d) strawberry juices. Data were calculated as the difference between sampling at the end of alcoholic fermentation and at the initial time. Error bars indicate the standard deviation among the replicates.

