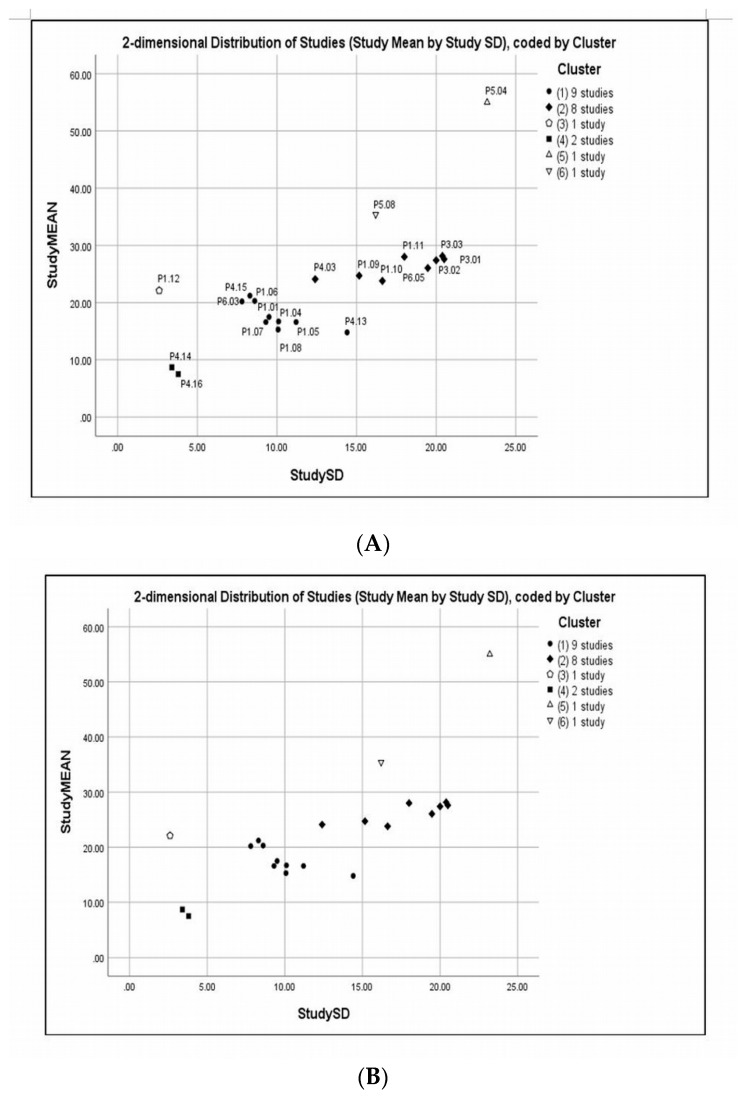
Figure 5.
Scatter plot of the study means versus SDs using 6-clusters memberships of the 21 included studies in the subgroup meta-analyses. Legend indicates the number of studies in each cluster, solid fill represents clusters with two or more studies, while open markers represent singleton study. Scatterplot of study means versus SDs with study codes (A) and without study codes (B).

