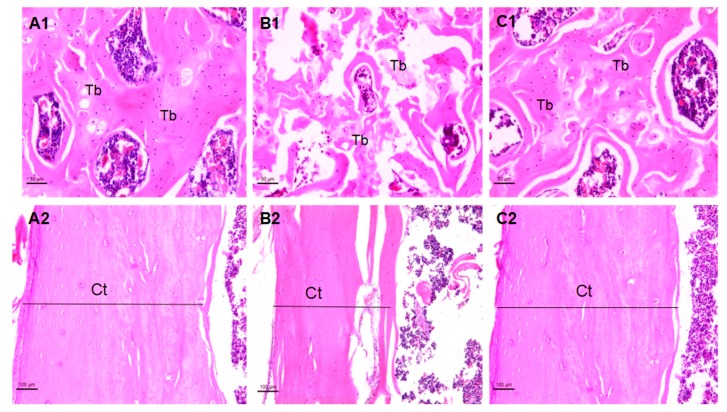
Figure 3.
The femoral and tibia morphology of rats in each group. (A1) The femur metaphysis in a rat of control group; (B1) the femur metaphysis in a rat of T1DM (diabetic) group; (C1) the femur metaphysis in a rat of the T1DM-icariin (ICA) group; (A2) the tibia in a rat of control group; (B2) the tibia in a rat of T1DM group; (C2) the tibia in a rat of the T1DM-ICA group. Hematoxylin and eosin staining, magnification: 200× Tb: Trabecular bone. Ct: Cortical bone.

