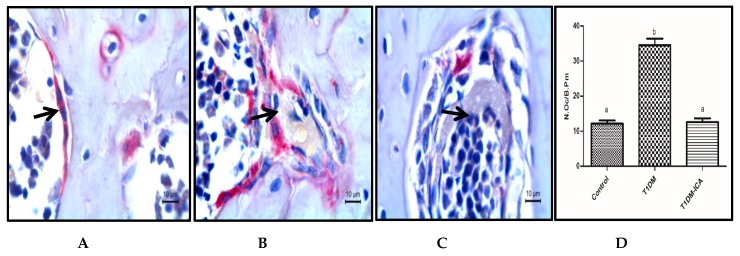
Figure 5.
The number of osteoclasts per bone perimeter (N.Oc/B.Pm) in each group. (A) Osteoclasts in femur bone tissue of control group rat; (B) osteoclast in femur bone tissue of T1DM group rat; (C) osteoclast in femur bone tissue of T1DM-ICA group rat; (D) the number of osteoclasts per bone perimeter (N.Oc/B.Pm); Values are presented as means ± SD. Different letters indicate statistically significant difference (p < 0.05). Femur bone tissue slides were stained by tartrate resistant acid phosphatase (TRAP), the black arrow points to osteoclasts.

