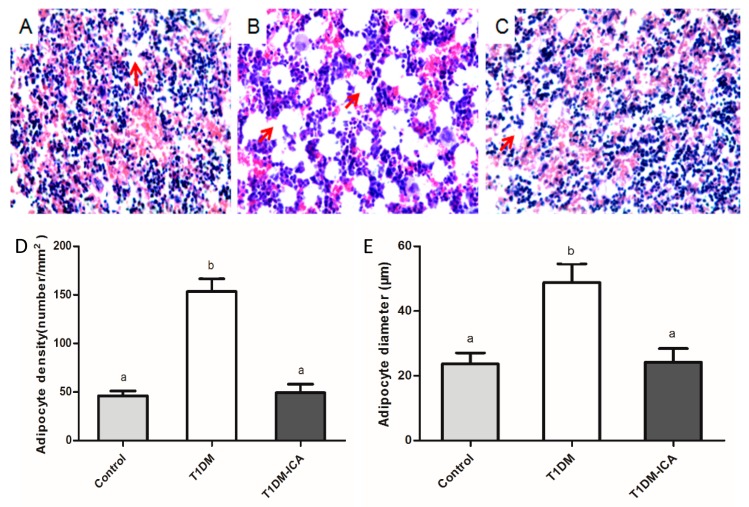
Figure 6.
Bone marrow adipocyte and their density and diameter in all experimental groups. (A) The tiba bone marrow of control rat; (B) the tiba bone marrow of T1DM rat; (C) the tiba bone marrow of T1DM-ICA rat; hematoxylin and eosin staining, magnification: 400×; (D) adipocyte density of tibia bone marrow in each group; (E) mean adipocyte diameter of tibia bone marrow in each group. Values are presented as means ± SD. Different letters indicate statistically significant difference (p < 0.05). Red arrows point to adipocytes.

