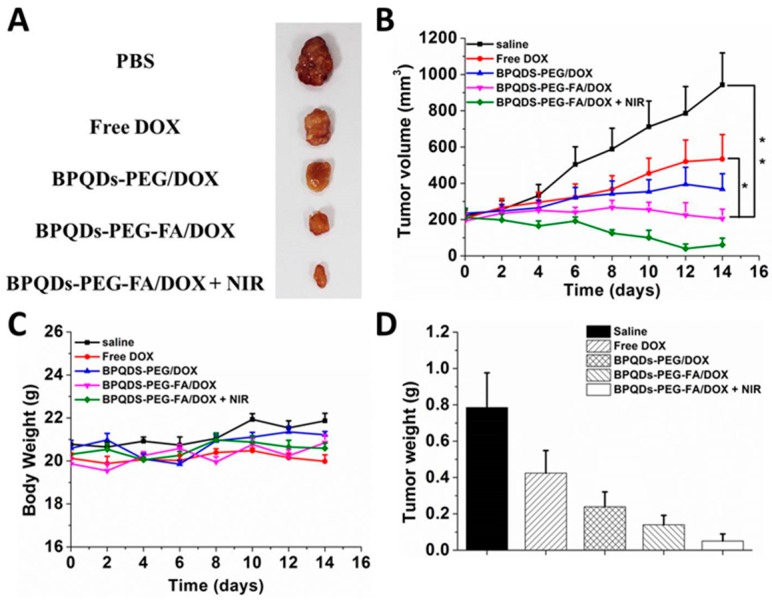
Figure 8.
In vivo chemo-photothermal synergistic therapy. (A) Representative photos of excised tumors after 14 days of treatments. (B) Tumor growth curves of different groups of tumor-bearing mice after treatments. (C) The changes of body weight of tumor-bearing mice after treatments. (D) Tumor weight of each group taken out from the sacrificed mice at the end point of research (n = 3, * p < 0.05, ** p < 0.01).

